The Operational Dashboard is designed to give an immediate, real-time operational view of network health. Its primary goal is to help quickly answer three critical questions:
-
Is the network up and running?
-
Is the network behaving correctly?
-
Are there any alerts to focus on right now?
It prioritizes mission-critical data and minimizes configuration to detect, investigate, and act on issues quickly.
To access the Operational Dashboard screen, click on the Operational Dashboard tab located on the Organization Dashboard.
The following screen shows an overview of the Operational Dashboard:
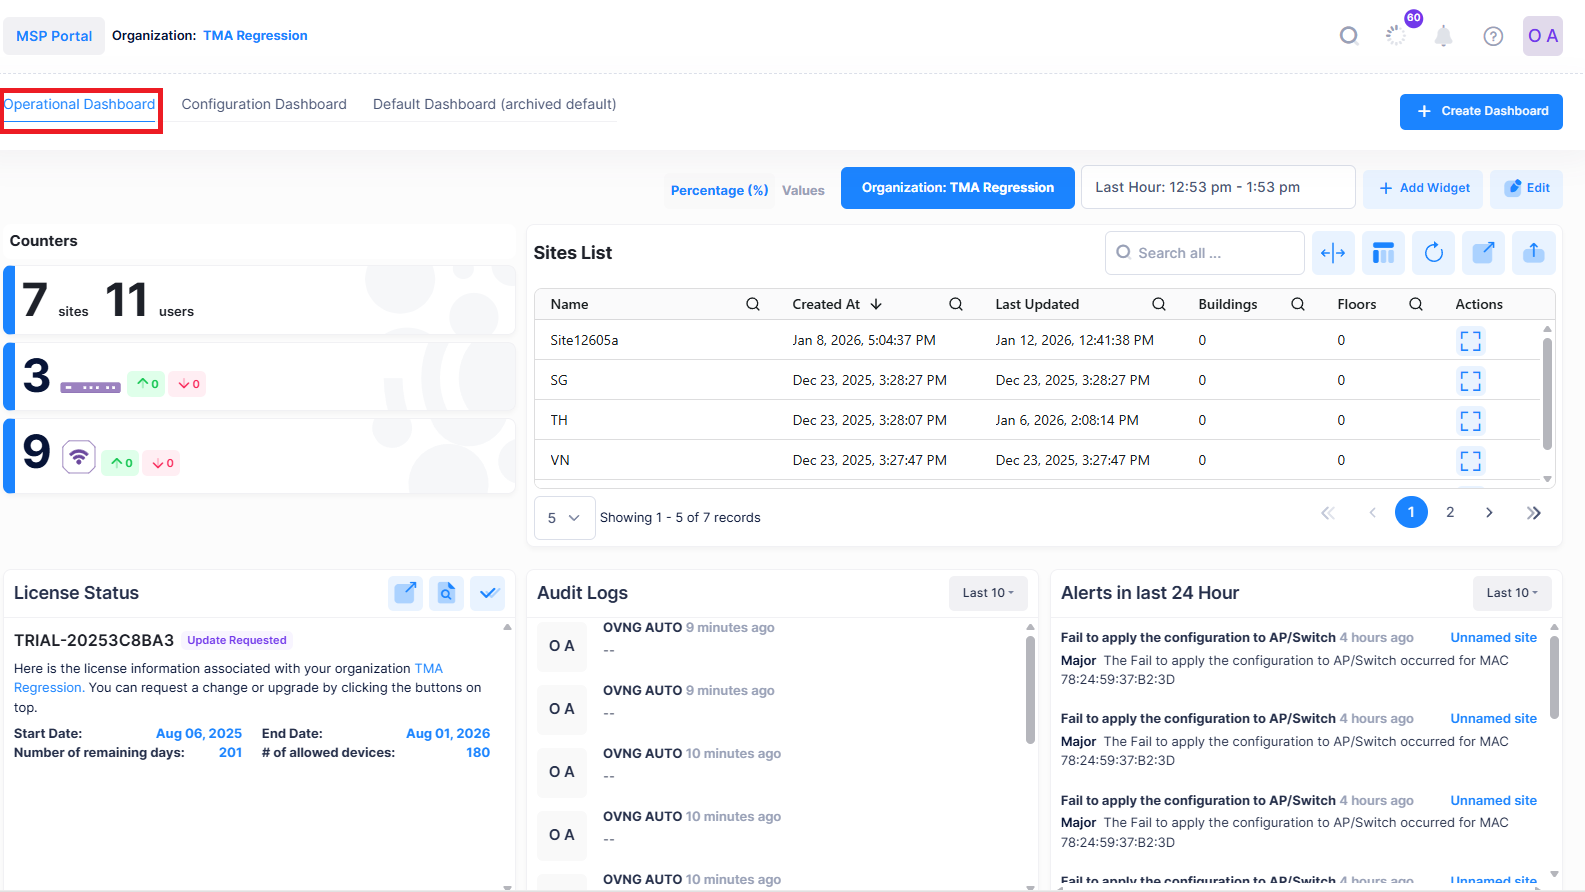
Operational Dashboard UI Functions
You can perform the following functions from the operational dashboard:
Percentage (%) Values:
Select percentage or value.
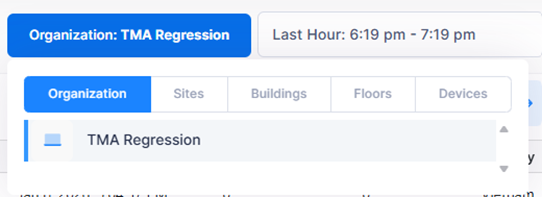
Select Entity:
The select entity allows to select the view for Operational Dashboard based on Organization, Sites, Building, Floors and Devices.
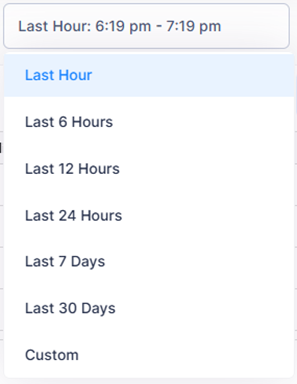
Time:
The time option allows to set the time frame for which the metrics must be displayed.
Add Widget:
The Add Widget option allows to add the Widget for which the metrics should be monitored.
See Adding a Widget to add widget to the dashboard.
Edit:
The Edit option allows to remove, modify or rearrange the Widget.
See Editing a Widget to edit a widget in the dashboard.