The Organization Administrator Dashboard is presented to an Organization Administrator at login. The Organization Administrator Dashboard is used to create and manage an organization’s network.
To access the Organization Dashboard: from the MSP Dashboard, click on the Organization Widget to bring up the organization administrator dashboard for that Organization.
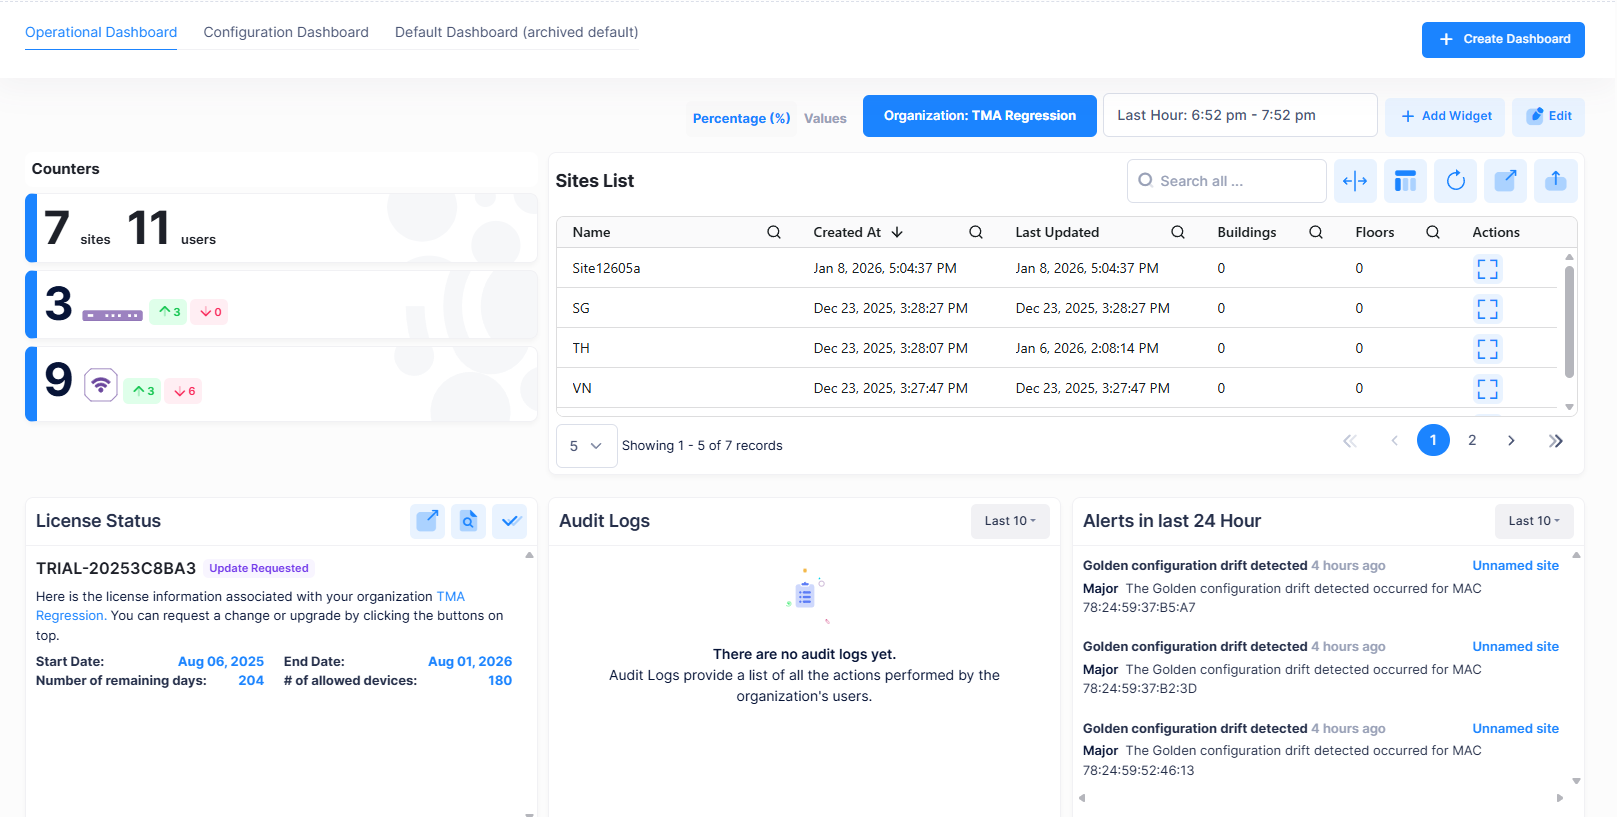
The below screen displays the Organization Dashboard:
The dashboard consists of Operational, Configuration, and Custom dashboard.
-
The Operational Dashboard, gives you a real-time view of your network health, highlighting key metrics, device status, and active alerts so you can quickly identify and troubleshoot issues.
-
The Configuration Dashboard helps you set up and manage your organization by providing visibility into sites, devices, users, licenses, and recent configuration changes.
It focuses on deployment status, setup progress, and administrative actions, giving you a clear overview of how your environment is configured. -
The Custom Dashboard allows you to create a new dashboard with a custom name, add/remove widgets to/from the dashboard, and customize the dashboard layout.
-
When upgrading OmniVista from version 10.5.1 to 10.5.2, the existing 10.5.1 default dashboard is automatically archived and displayed as “Default Dashboard (archived default)”.
-
The archived dashboard is displayed alongside the two new default dashboards: Operational Dashboard and Configuration Dashboard.
-
The archived default dashboard can be customized or deleted.
-
For a fresh 10.5.2 installation, only the two default dashboards (Operational and Configuration) are displayed by default. You can then add custom dashboards.