There are two dashboards in OmniVista Cirrus - the Managed Service Provider (MSP) Dashboard, and the Organization Dashboard.
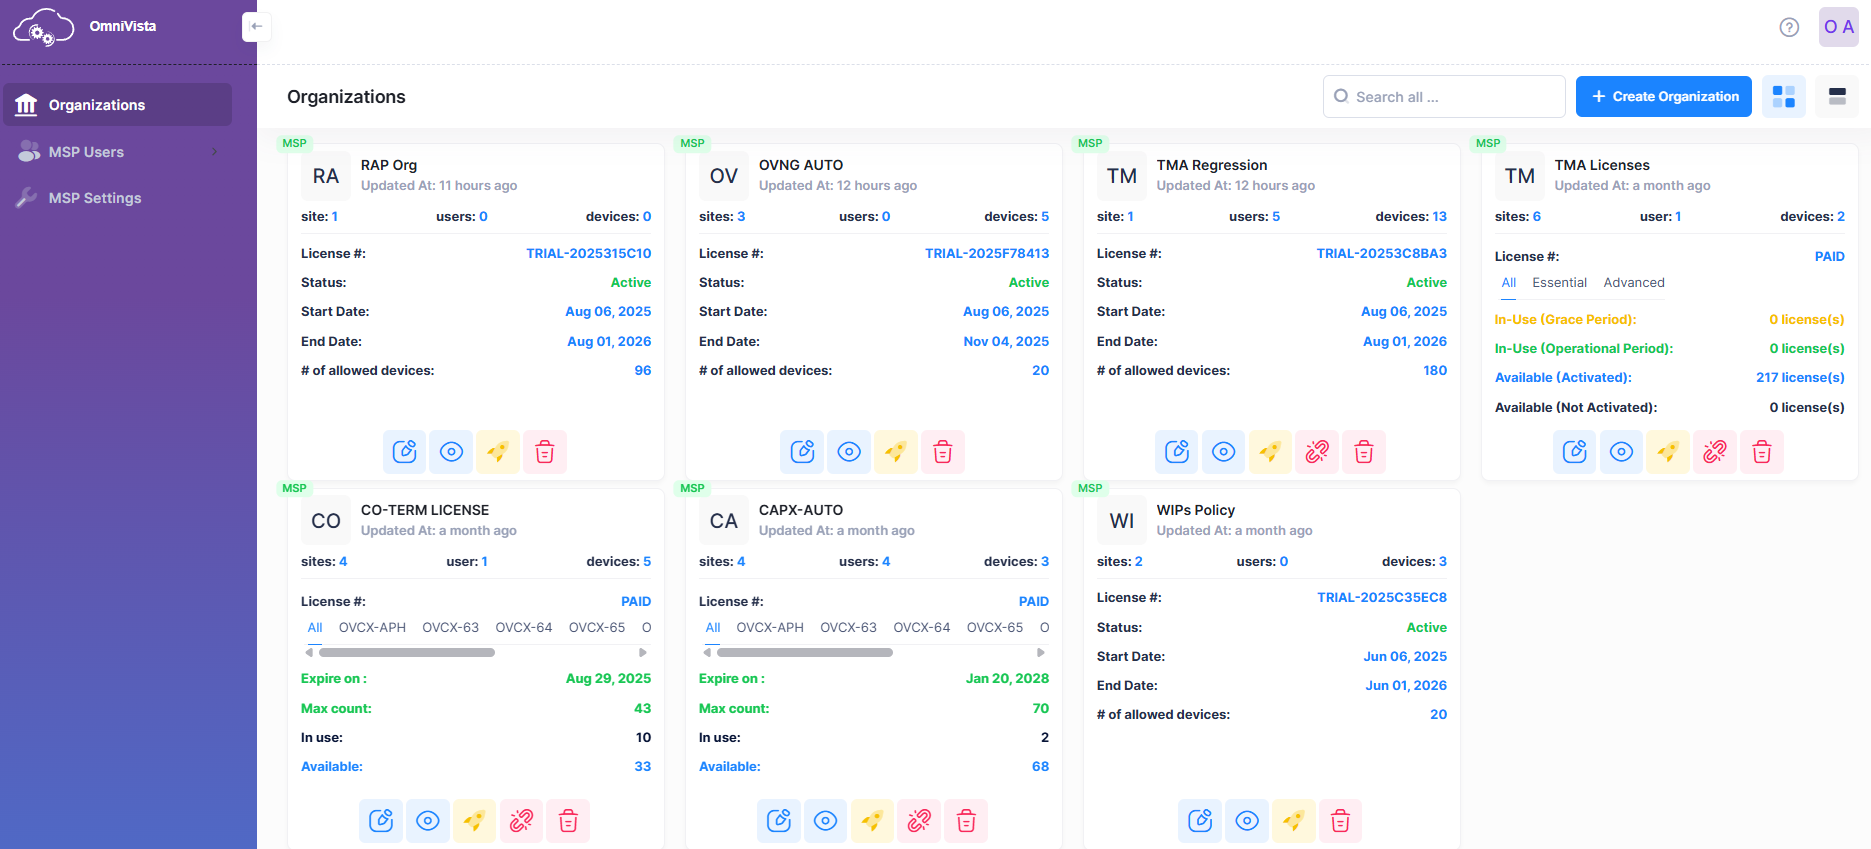
The MSP User Dashboard is initially presented to an MSP User at login. The Dashboard displays widgets for any Organizations the MSP User is managing and is used to access the Organization Dashboard for an Organization.
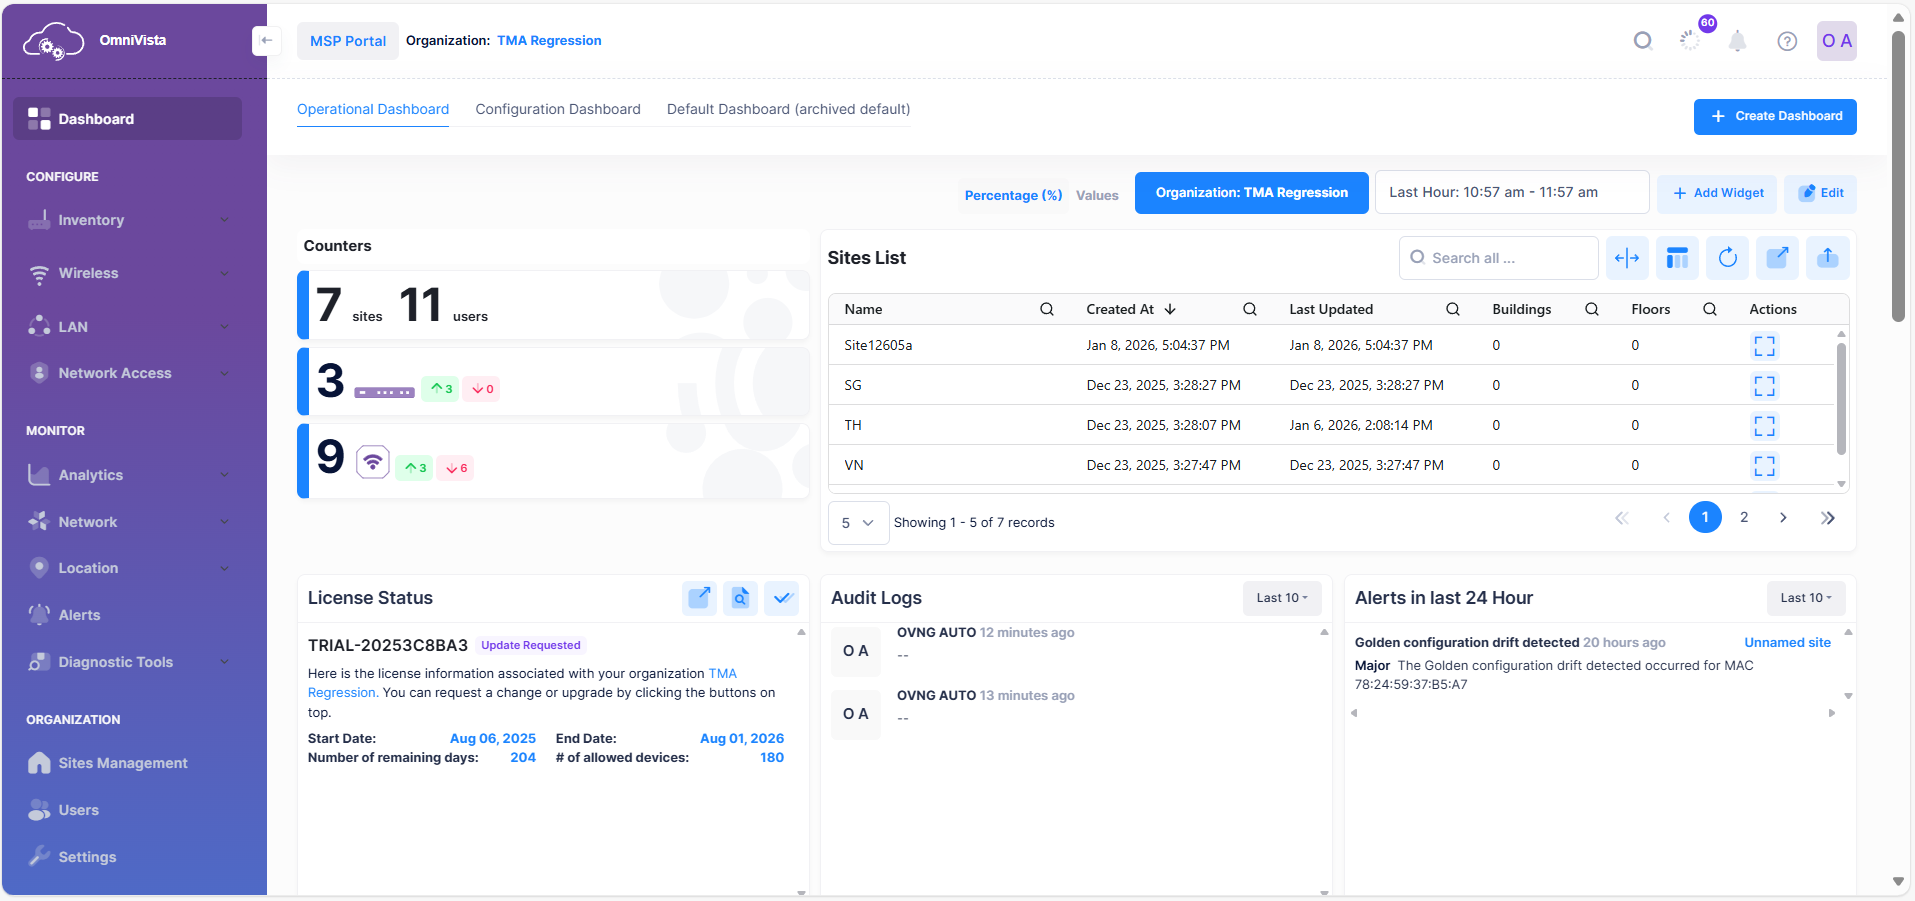
The Organization Dashboard is presented to an Organization User at login. The Organization Dashboard is used to manage an Organization (create sites, buildings, floor) and monitor an Organization’s network (e.g., create devices, monitor devices).
This section provides an overview of the OmniVista Cirrus User Interface for both dashboards, including common tools used for working with tables and graphical displays, as well as the OmniVista Cirrus Menu, which is used to access OmniVista Cirrus functions and applications.