Information in OmniVista Cirrus is presented in table (e.g., Device Catalog) and graphical form (e.g., Analytics). This section provides an overview of the common tools/operations found in tables and graphical displays in OmniVista Cirrus.
Tables
Tables in OmniVista Cirrus provide an overview of information that can be sorted and filtered and are used for configuration. For example, the Device Catalog displays a list of network devices and can be used to add, edit, and delete devices. Common table tools and operations are detailed below.
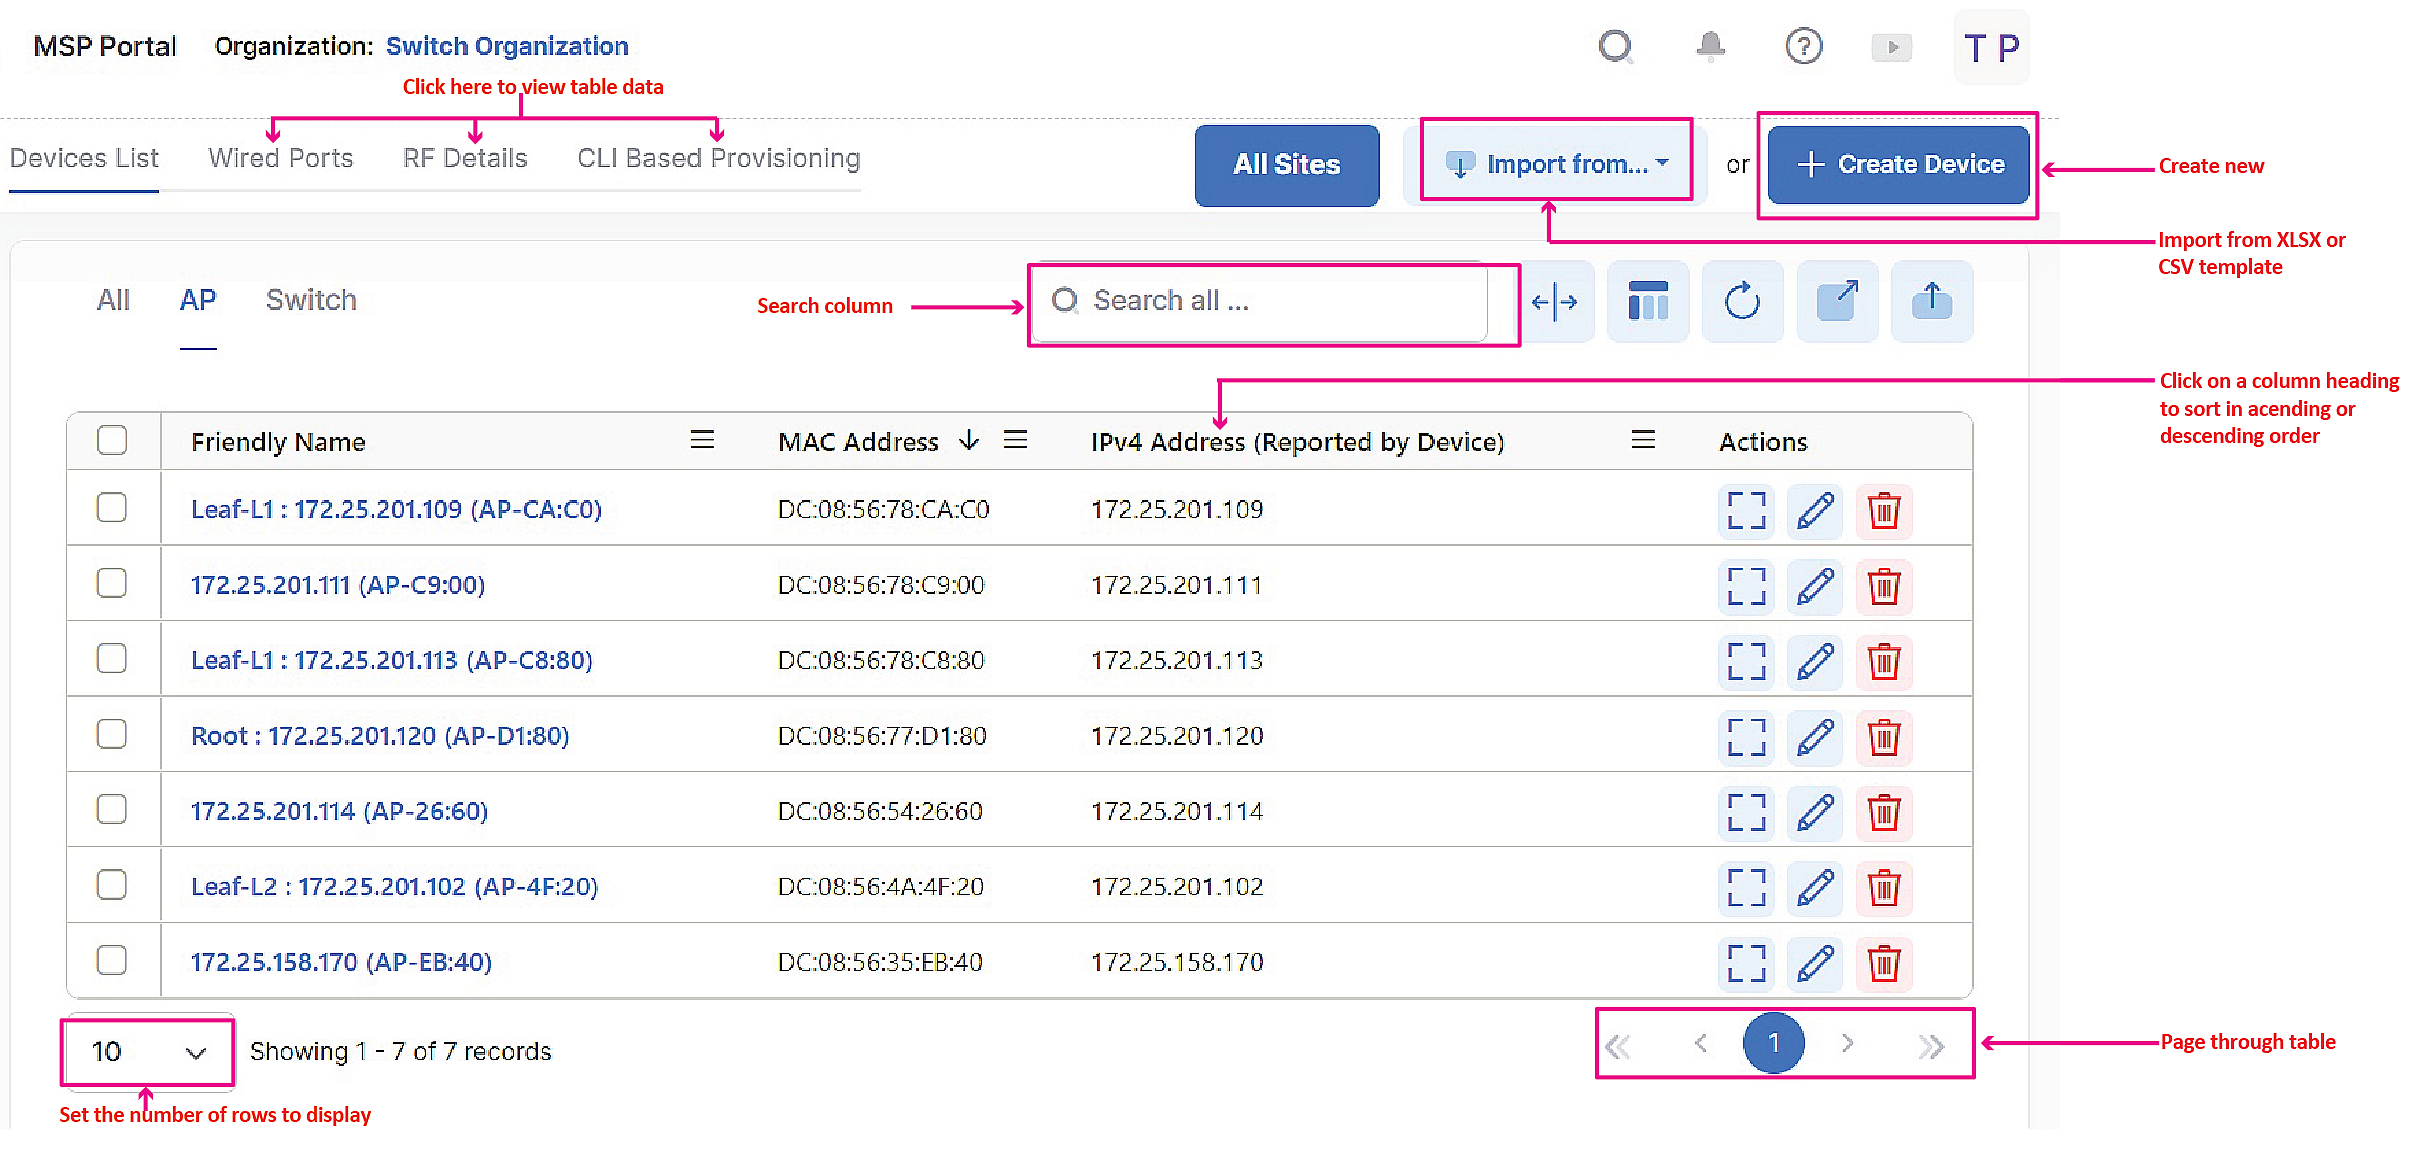
Table Tools and Operations
-
Sorting and Filtering - By default, tables are sorted in ascending order based on the first column. You can sort a table by one or more columns in ascending or descending order by clicking on any column heading. To filter data for one or more columns, click on the magnifying glass in the top-right corner of a column and select the filtering data. See Sorting and Filtering Tables for more information.
-
Search - Enter search criteria in the Search Bar at the top of the table to search for specific information in a table. The table will be filtered as you enter search criteria. Delete the search criteria from the Search Bar to return to the previous display. You can also search for information in a specific column by clicking on the Search icon at the top of the column and entering search criteria. Delete the search criteria to return to the previous display.
-
Configure Display - You can change the display using the icons at the top of the table.
-
Search all - By default, information from all sites is displayed. Enter a name of the site to select a site to display information from a specific site.
-
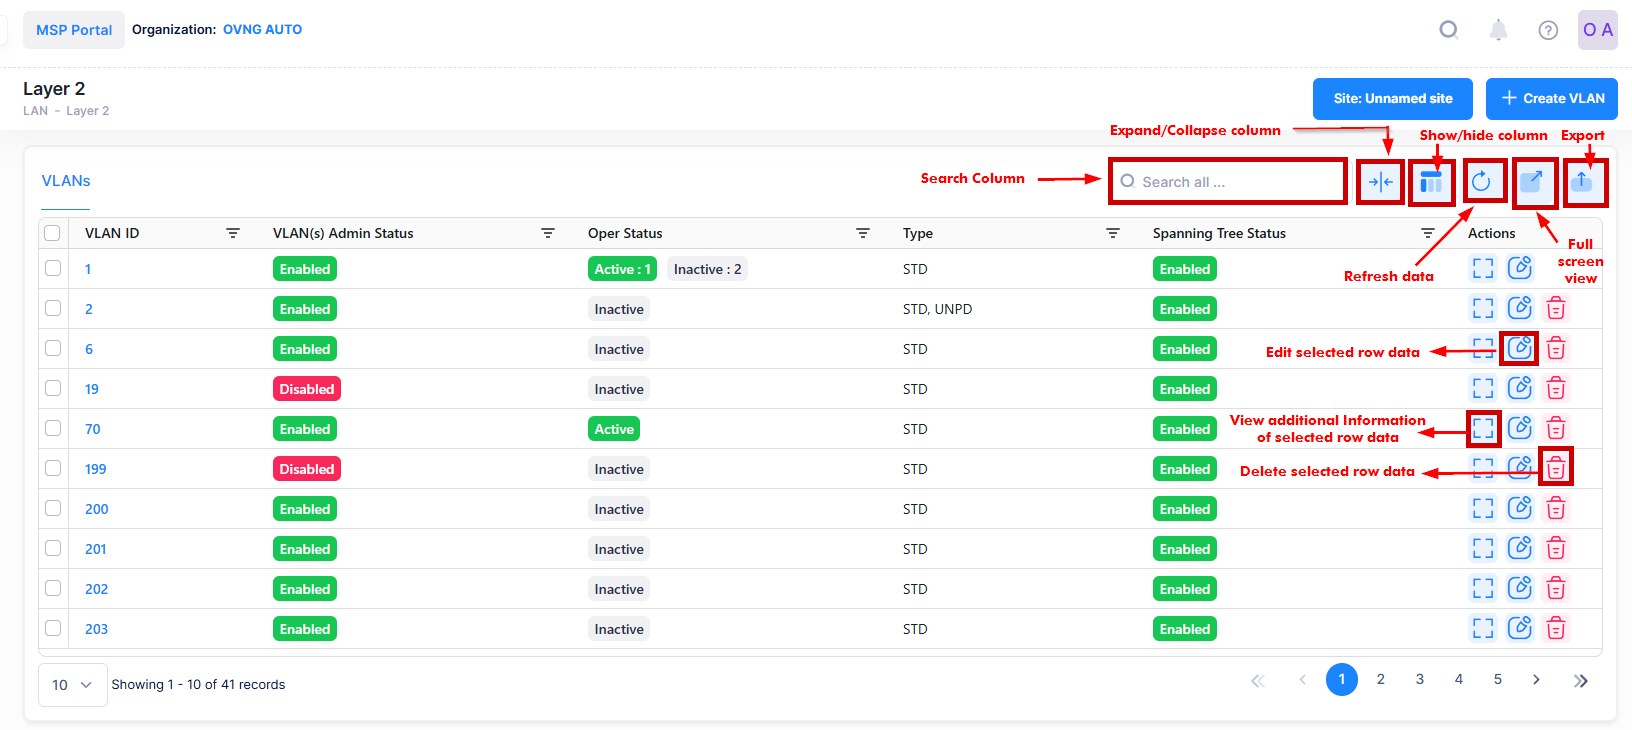
Expand/ Collapse - By default, the display is set to Collapse View, which automatically sizes tables (limiting the columns displayed) based on the display area available. Click on the icon to toggle to Full View and display all columns in a table. Click on the icon again to return to Collapse View.
-
Show/Hide Columns - By default, all columns in a table are displayed. Click on the icon to select specific columns you want to display. This selection will remain in place until it is changed. You can change the columns displayed at any time. You can also choose to ‘Select All’ and ‘Deselect All’ option to select or unselect all columns. In addition, you can pin a specific column to the left side of the table (see Pin a Column to the Left for more information).
-
Refresh Data - Click on the refresh button to retrieve the most recent data from the OmniVista Cirrus database.
-
Full Screen View - Click on the icon to display the table in Full View (the table will expand to cover the entire screen. Click on the Quit full screen mode button, or press Esc to return to the default view.
-
Export - Click on the Export button to export the table to an Excel, .csv, or PDF file.
-
Configuration - Click on an icon in the Actions column next to an entry to view detailed information, edit, or delete an entry.
-
Set Number of Lines to Display - By default, 10 lines of a table are displayed. Click on the drop-down to change the number of lines displayed.
-
Page Through Table - Click on the Forward and Back arrows or select a page number to page through a table.
Graphical Displays
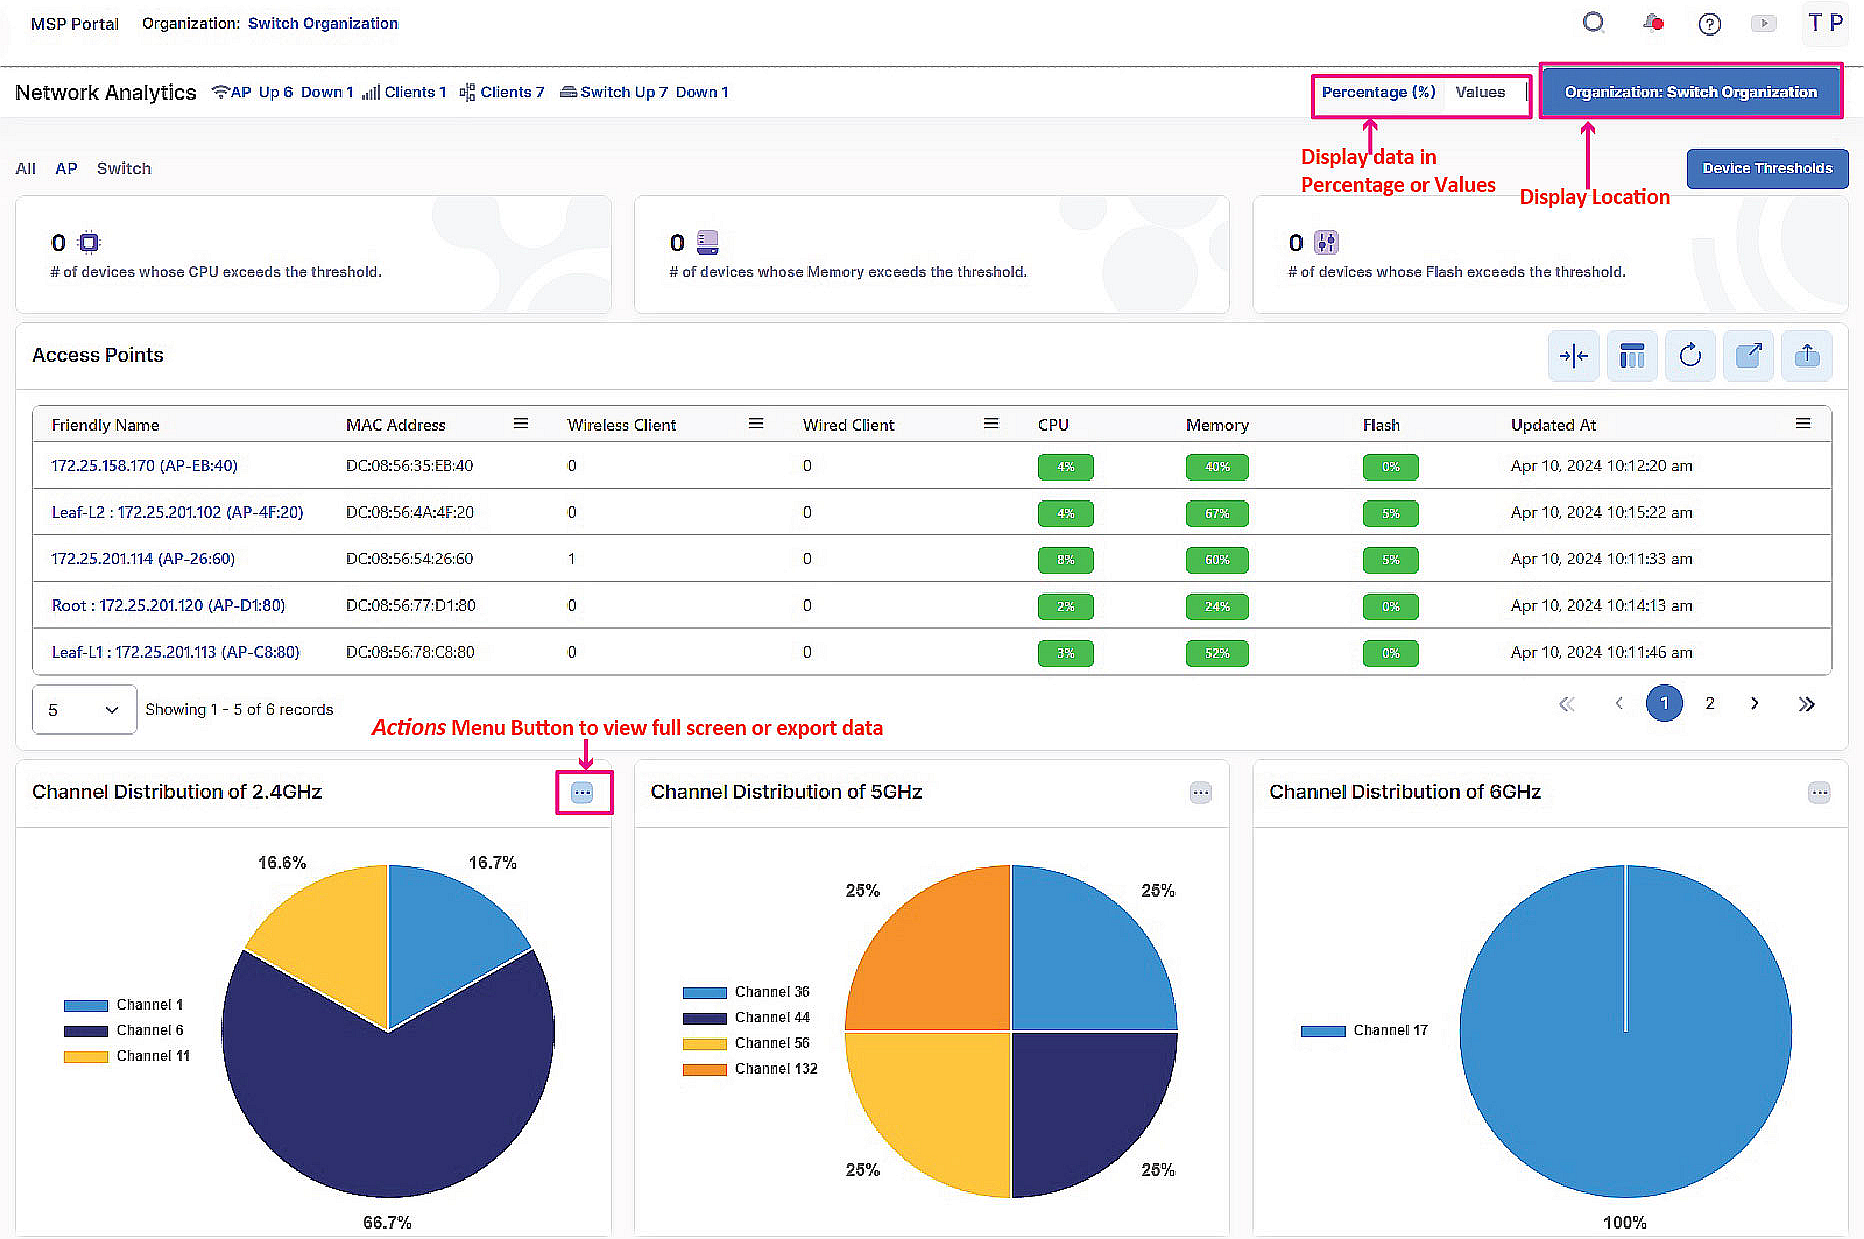
Graphical displays in OmniVista Cirrus provide an overview of information that can be filtered by location and time range. You can also change the display format (percentage/values), and export information to and Excel or .csv file. Common graphical display tools and operations are detailed below.
Graphical Display Tools and Operations
-
Display Format - By default, data is displayed in percentages. Click on the button to display data in numerical (Values) format. Click again to toggle the display back to percentage format.
-
Display Location - By default, data for all sites in an Organization are displayed. Click on the button to display the data for a specific Site, Building, Floor, or AP.
-
Display Time Range - By default, data for the last hour is displayed. Click on the button to display data for the last 6 Hours, 12 Hours, 24 Hours, Week, Month, or a Custom Range. Data is stored in OmniVista Cirrus for one year, so a Custom Range can go back one year.
-
Actions - Click to enlarge a widget to full screen view, or to export the data in the widget to am Excel or .csv file in tabular format.
Pin a Column to the Left
Pinned or frozen columns are columns that remain visible at all times while you scroll horizontally through a data grid. These columns can be affixed to the left side of the grid to ensure they remain visible.
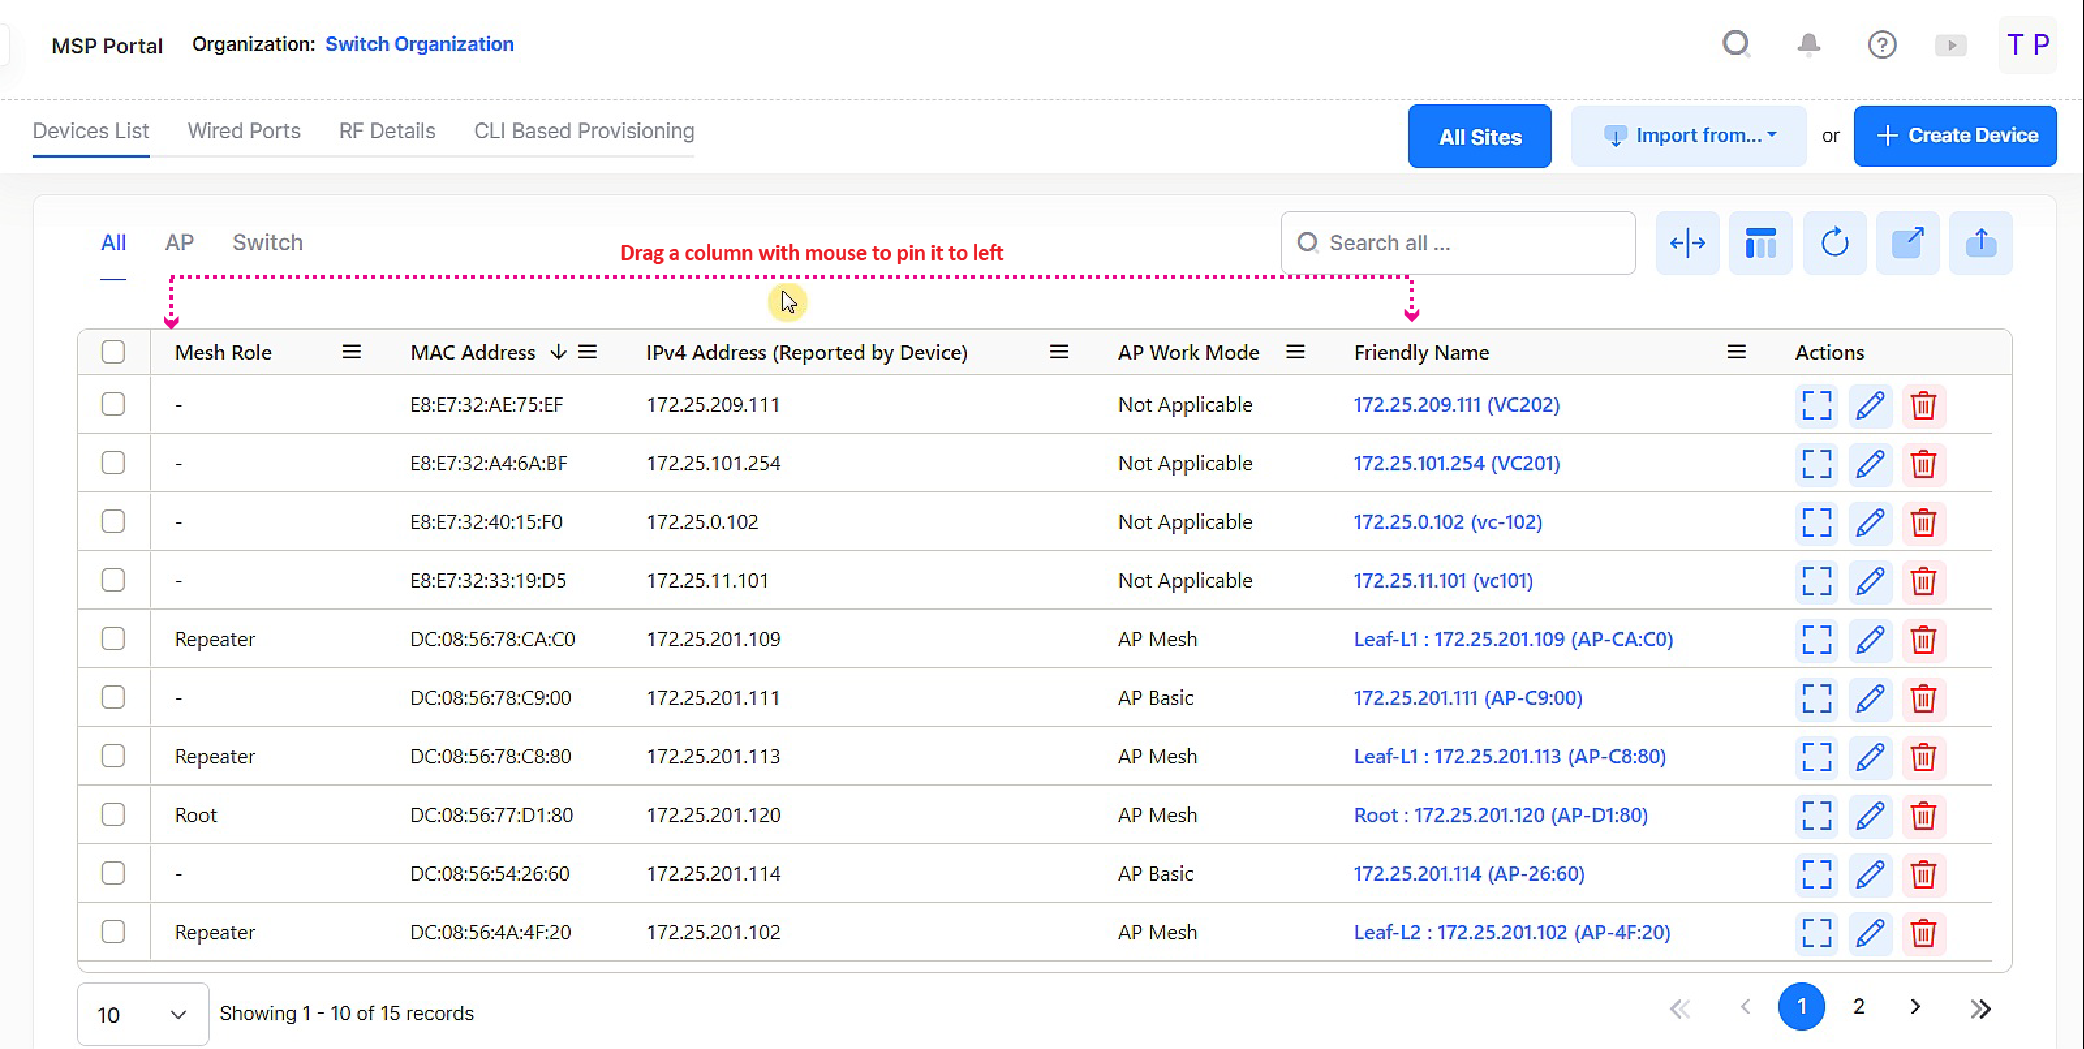
To pin a column, select the desired column and drag it to the left side of the data grid. This will lock the column data to the left-hand side of the data grid.
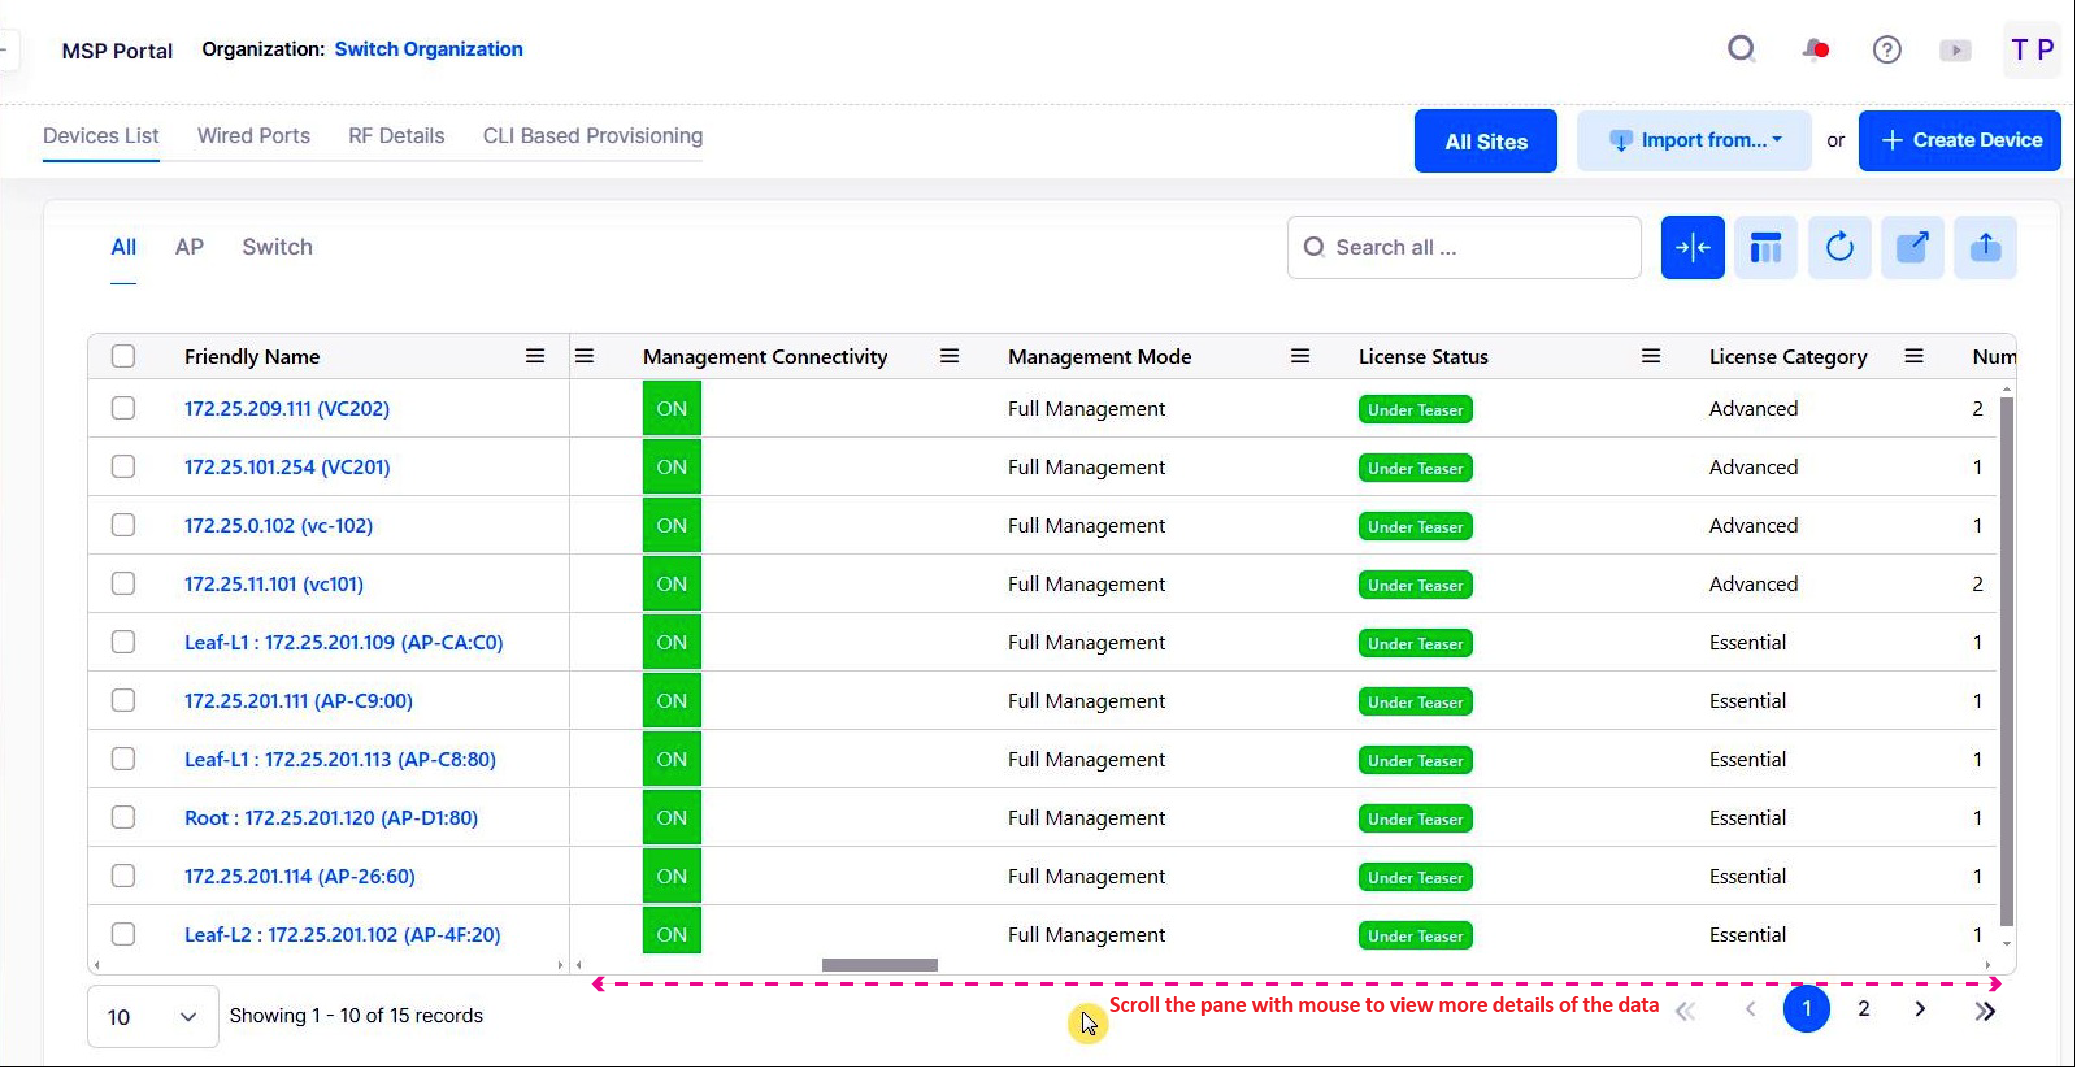
To view additional details of the pinned data, scroll through the pane on the right-hand side of the grid.
To unpin a column, select the pinned column on the left and drag it to the right-hand side of the data grid, then release the column. This will release the column data from being pinned to the grid.