The information provided on this page applies to general troubleshooting questions and actions when using OmniVista Cirrus. You can also find troubleshooting information embedded within the following features:
Troubleshooting Switch Management Problems (Management Connectivity, Configuration/Statistics Updates, Configuration Not Delivered)
I signed up for a new account (or an invited account), but I can't find the verification email to activate my account
My account has been successfully created but I don’t see any data in OmniVista Cirrus 10
From the OmniVista Cirrus 10 UI, how do I know if my Access Points are connected to the platform?
One of the three open browser tabs running OmniVista Cirrus 10 is not responding
I want to update a configuration object, but I can't click on the Save button. It is disabled (grayed out)
When I edit a configuration and click on “Launch … in a new browser tab” to open another screen to edit a related configuration, when I return to the main screen, the Save button is disabled (grayed out)
I open an SSH Terminal session after entering login credentials, but there is no message in the Terminal window console
The Access Point Health Threshold data doesn’t reflect the changes done even after saving the changes and getting the success notification message.
The Device Health color and counter aren't updated after the threshold was saved and getting the success notification message.
I am not able to customize the WiFi4EU captive portal template for SSID and got error 500 when deploy changes to Access Point with layout type WiFi4EU.
In Configuration Backup table, I got timeout message after waiting for 1 minute "Can not connect to the server, the request has been timeout. Please try again later."
When I click on Full screen mode to put table in full screen mode, the top toolbar buttons disappear.
When I open an OmniVista Cirrus page, I wait for more than 15 seconds for the Loading the screen.
For the Guest Access code or Guest Account screen, I cannot find the Service level or Registration Profile selection when creating or updating a Guest Account or Guest Access code.
When I access the Wi-Fi Heatmap screen, the Device icon disappears upon selecting the Channel utilization option from the Device Layers drop-down list.
When I try to copy the Golden Configuration content to the clipboard in the ‘Device Detail’ section on the left side of the screen (Monitor > Network > Analytics > Network Analytics), it does not work.
I’m unable to get MACsec working between an OmniSwitch and AP.
Click to expand...
-
Make sure the AP model is an AP-1321 or AP-1361 with AWOS >= 5.0.3.13. Check the AP release notes for additional models that may support MACSEC.
-
Login to OVNG Org:
-
To Create Provisioning Configuration - Navigate to Wireless->Profile->Provisioning Configuration. Click on Create Provisioning Configuration.
-
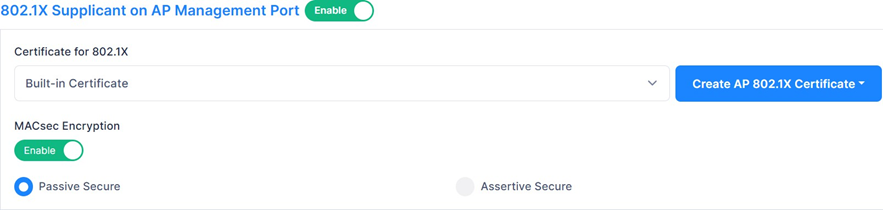
Enable the options as shown below.
-
-
-
Create Access Points Groups - Navigate to Wireless->Profile->Access Points Groups and click on Create Access Points Groups and select the provisioning configuration created in the above step.
-
Add the Access point under inventory and select Access Points group created in above step.
-
Connect the specified model of APs to the switch which has minimum AOS version of 8.10.93.R03 or above and MACsec license installed. Check the AOS release notes to get the list of switches and ports that support MACsec.
-
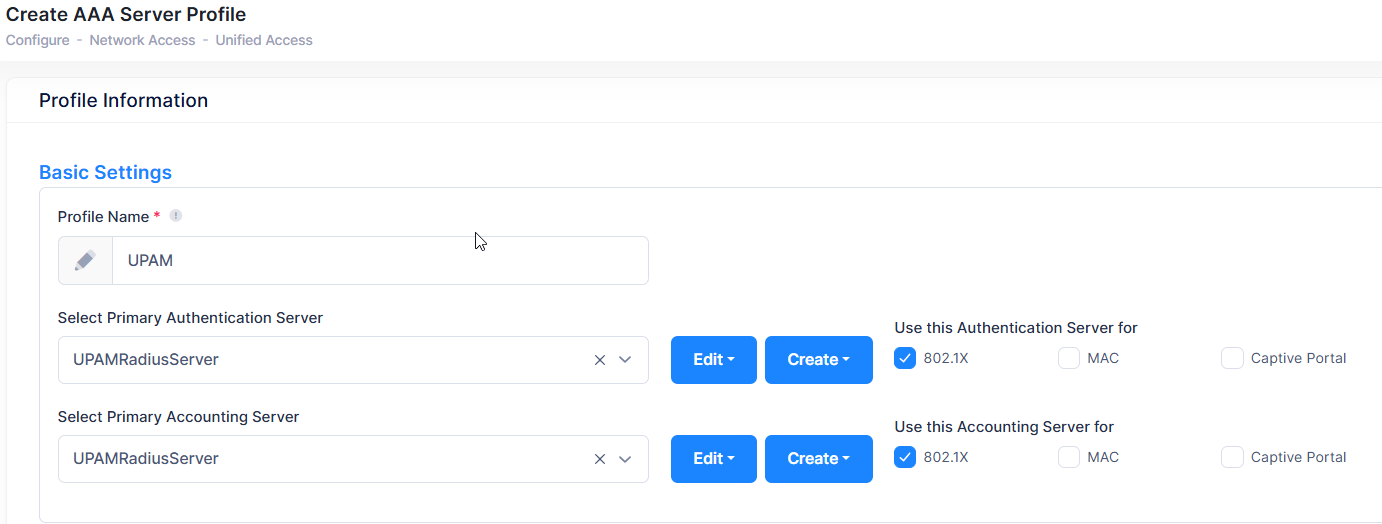
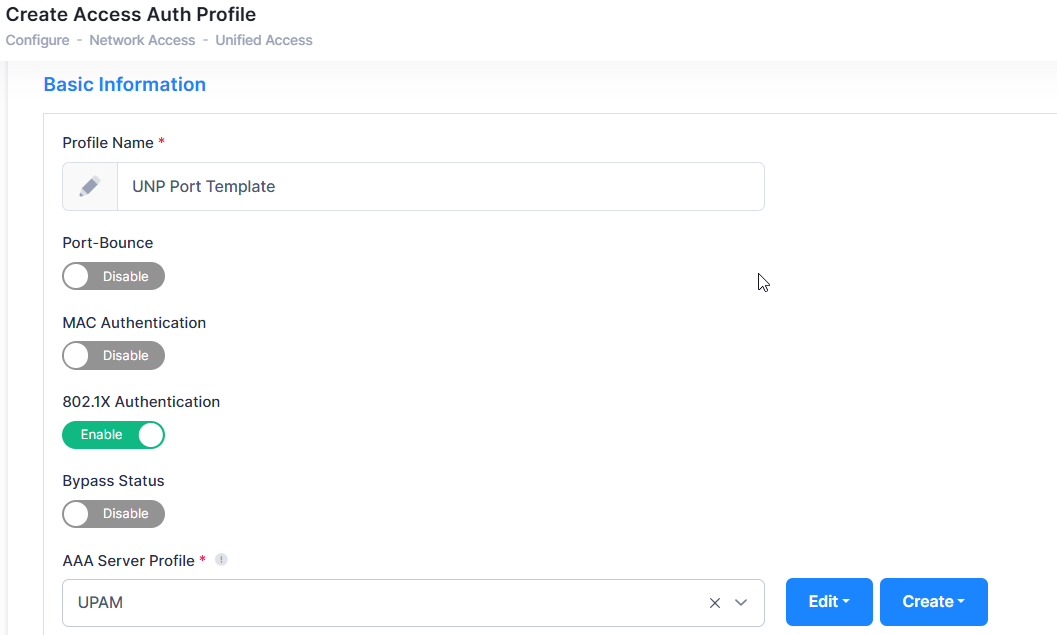
Configure AAA and UNP with 802.1x enabled on the port the AP is connected to as shown below.
AAA Configuration. Configure AAA Profile with the desired AAA Server as 802.1X Authentication Server.
UNP Port Template Configuration. Configure UNP Port Template with 802.1X Authentication enabled and AAA Profile above
-
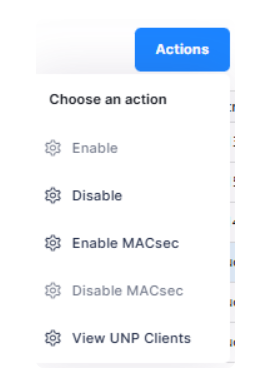
Enable MACsec with Dynamic RADIUS mode on the interface port of the OmniSwitch where the AP is connected by navigating to Device Catalog-> Wired Ports, select the switch and under Actions choose Enable MACsec.
-
Verification steps:
Check the UNP user details
ACC-31-> show unp user details mac-address dc:08:56:34:74:a0
Port: 2/1/13
MAC-Address: dc:08:56:34:74:a0
SAP                            = -,
Service ID                      = -,
VNID                            = -,
VPNID                          = -,
ISID                            = -,
VPLSID                          = -,
Access Timestamp                 = 10/30/2025 17:22:53,
User Name                       = DC08563474A0,
IP-Address                      = 10.110.0.52,
Vlan                            = 1100,
Authentication Type             = 802.1x,
Authentication Status           = Authenticated,
Authentication Failure Reason = -,
Authentication Retry Count      = 0,
Authentication Server IP Used = 143.209.0.2,
Authentication Server Used      = UPAMRadiusServer,
Server Reply-Message            = -,
Profile                         = defaultWLANProfile,
Profile Source                  = Auth Pass - LLDP Rule UNP,
Profile From Auth Server        = -,
Implict Trust-Tag Source        = -,
RADIUS Alcatel-trust-tag-vlans = -,
Session Timeout                  = 0,
Classification Profile Rule     = -,
Role                            = -,
Role Source                     = -,
User Role Rule                  = -,
Restricted Access               = No,
Location Policy Status          = -,
Time Policy Status              = -,
QMR Status                      = Passed,
Redirect Url                    = -,
SIP Call Type                   = Not in a call,
SIP Media Type                  = None,
Applications                     = None,
Encap Value                     = -,
Rule ID                         = 7,
Total users : 1
Check the MACsec configuration.
ACC-31-> show interfaces macsec dynamic 2/1/13
                                                               Server     Transmit        Key      Operation
Chas/Slot/Port  Admin-State   Mode       Keychain  Encryption  Priority   Interval(Sec)   Server   Status
--------------+-----------+---------+------------+-----------+----------+--------------+---------+-----------
2/1/13           Enabled       radius      NA        Enabled       10          2             YES      UP
Ping between AOS and AP to confirm connectivity.
ACC-31-> ping 10.110.0.52
PING 10.110.0.52 (10.110.0.52) 56(84) bytes of data.
64 bytes from 10.110.0.52: icmp_seq=1 ttl=63 time=1.76 ms
64 bytes from 10.110.0.52: icmp_seq=2 ttl=63 time=1.51 ms
64 bytes from 10.110.0.52: icmp_seq=3 ttl=63 time=4.22 ms
64 bytes from 10.110.0.52: icmp_seq=4 ttl=63 time=9.16 ms
64 bytes from 10.110.0.52: icmp_seq=5 ttl=63 time=23.5 ms
64 bytes from 10.110.0.52: icmp_seq=6 ttl=63 time=1.78 ms