
The Dashboard provides MSP administrators with a consolidated, cross-organization view of device status and health across all OV Lite organizations under the MSP’s management. The dashboard appears to an MSP administrator at login. The Global Dashboard aggregates device-level information from all organizations into a single view with KPI widgets and a unified device table.
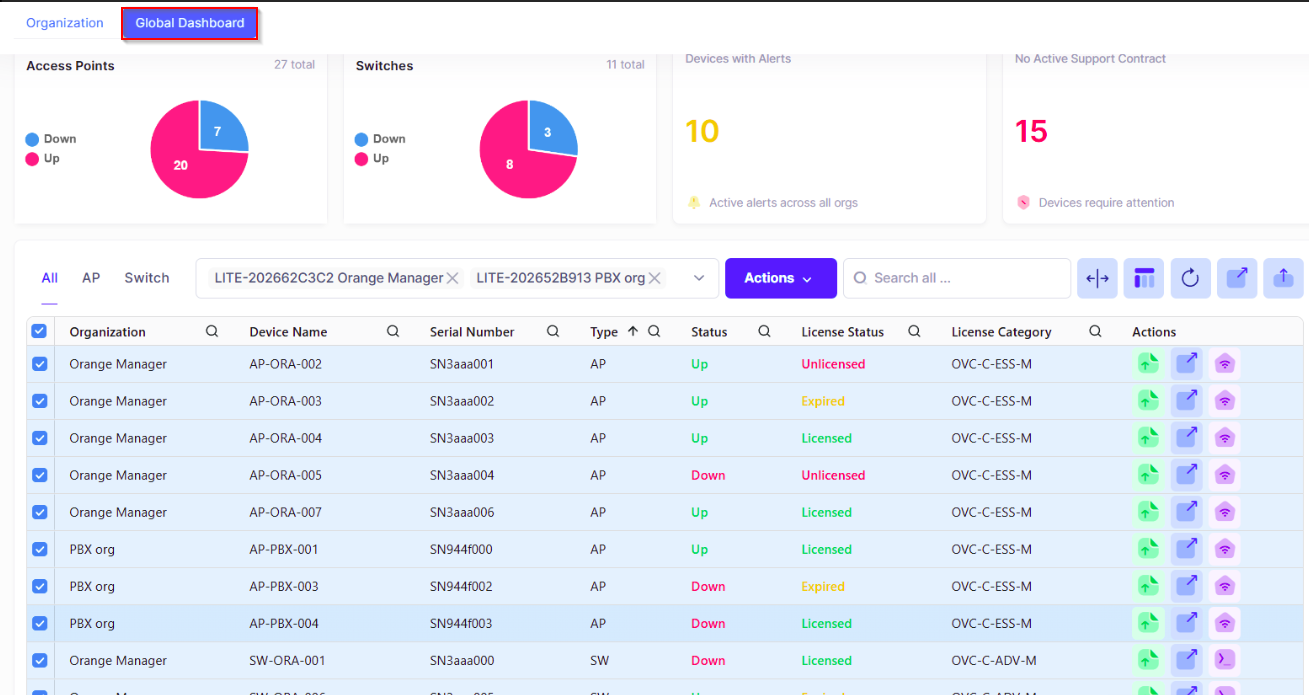
From this dashboard, you can select multiple organizations to monitor and compare organization health.
UI Functions
The following functionalities are available on the Global Dashboard screen:
-
WLAN Access Point Status - A pie chart showing the distribution of all wireless access points across all OV Lite organizations by status:
-
Up (green) - APs currently reachable and operating normally.
-
Down (red) - APs that are unreachable or not responding.
-
Unknown (yellow) - APs whose status cannot be determined.
-
Click on a pie chart slice to filter the device table to show only AP devices with the selected status.
-
LAN Switch Status - A pie chart showing the distribution of all LAN switches across all OV Lite organizations by status (Up, Down, Unknown). Click on a pie chart slice to filter the device table to show only switches with the selected status.
-
Total Number of Devices with Alerts - A widget showing devices that have active alerts. Click to filter the device table to display only devices with alerts. The ‘Alert’ column in the table shows the per-device alert count consistent with the selected filters.
-
Organization Health (Good / Bad) - A widget displayed alongside the device distribution pie charts showing the count of organizations in Good and Bad states:
-
Good - All devices in the organization have status Up, or the organization has no devices.
-
Bad - At least one device (AP or Switch) in the organization has Unknown or Down status.
-
The Global Dashboard is available only to authorized MSP users. Organization-level administrators see the Organization Dashboard when the user log in.