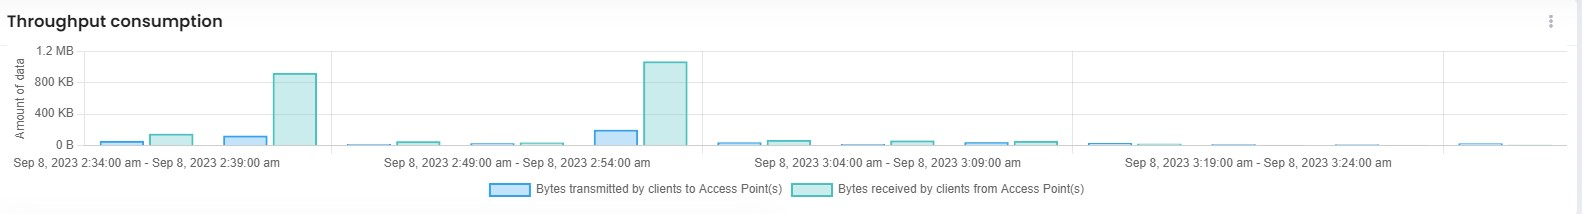
The Throughput Consumption section of the Client Analytics Dashboard includes a Bar Chart widget representing the number of bytes received and transmitted by Clients to Access Points over time.
Data displayed in the bar chart widget can be exported into a CSV or Excel sheet format. You can also switch the widget to full-screen mode for a better display.