Use the display filters on the dashboard to define the scope of client activity that you want to monitor based on the organization/ sites/ building/ floors or Devices.
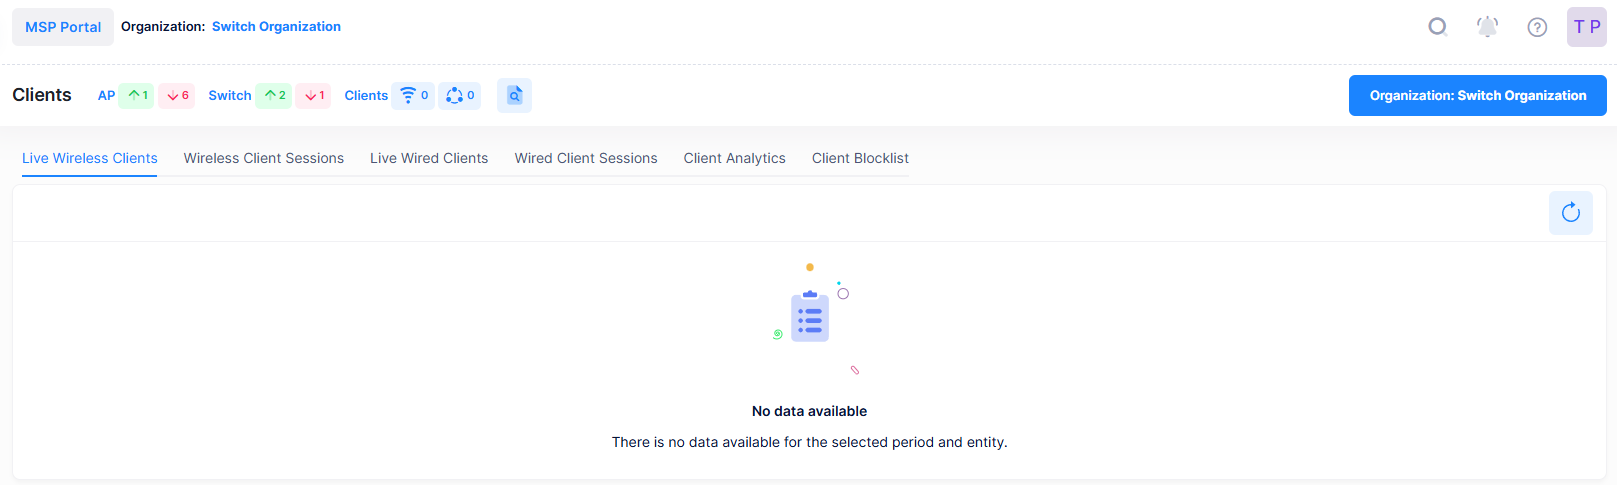
The Network Analytics Summary at the top of the dashboard displays the total number of Access Points, Access Points Up, Down Count, number of Live Wireless and Wired Clients, total number of Switches, Switches Up and Down Count in the Network.
Further, the Clients Dashboard is divided into four sections to monitor the Live wireless and wired Clients activities:
Note that the information gathered for “Device Type” and “Device OS” fields in any of the above sections depends on the information provided by the AP Client. As a result, these fields may appear blank based on the capability of the Client to provide the information.