The Network Analytics Summary displays a summary of the following parameters at the top of the Dashboard:

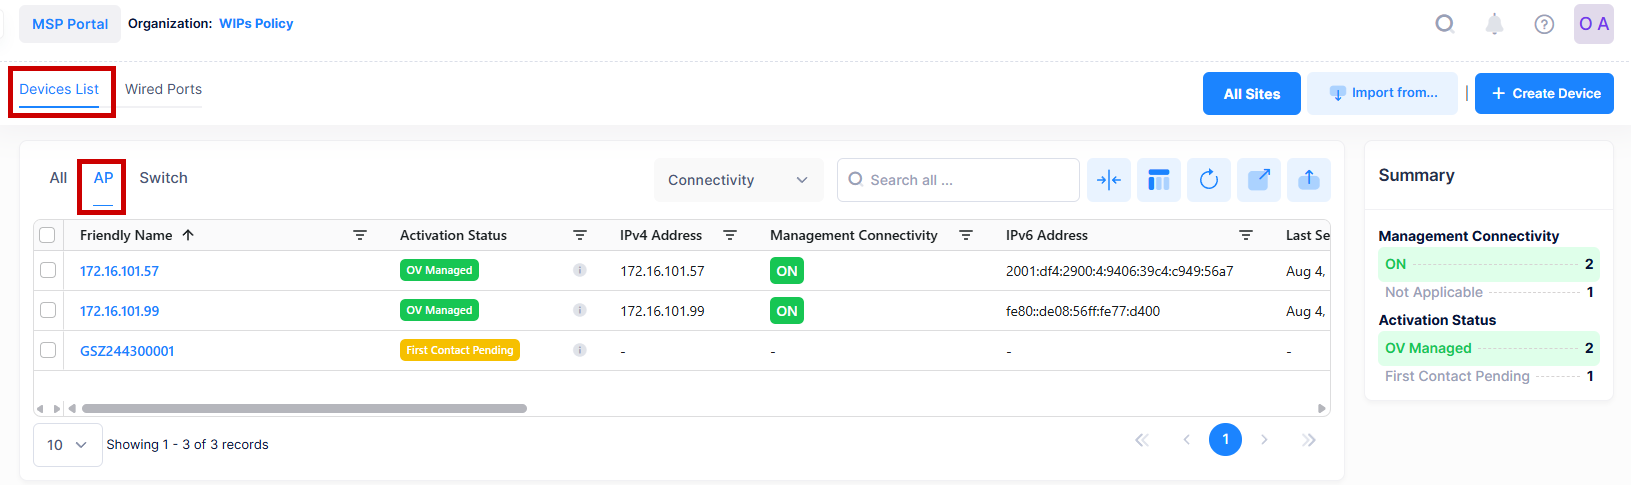
Access Points Count
Displays the total number of Access Points connected in the Network, as shown below.

When you click on the Access Point Counter, you are redirected to the Devices List screen, which displays a list of total devices that are connected to the Network.
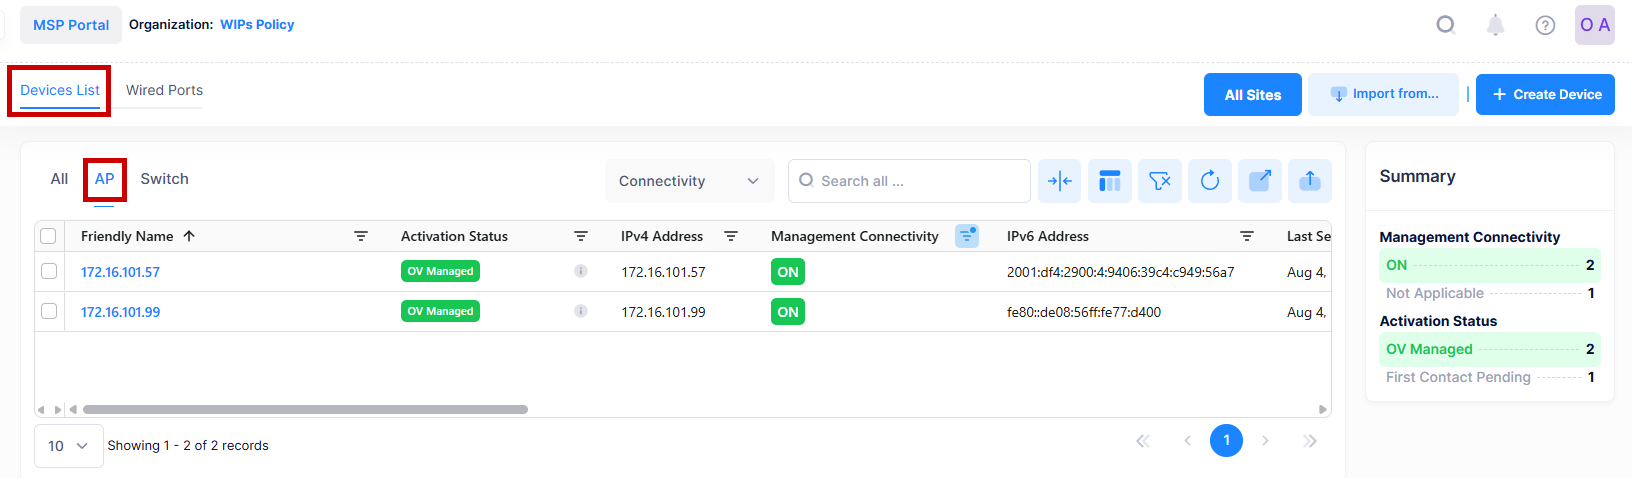
Access Points Up Count
Displays the number of Access Points that are Up (Management Connectivity status is “On” or “Not Applicable”), as shown below.

When you click on the Access Point Up Counter, you are redirected to the Devices List screen, which displays a list of only those devices that are up.
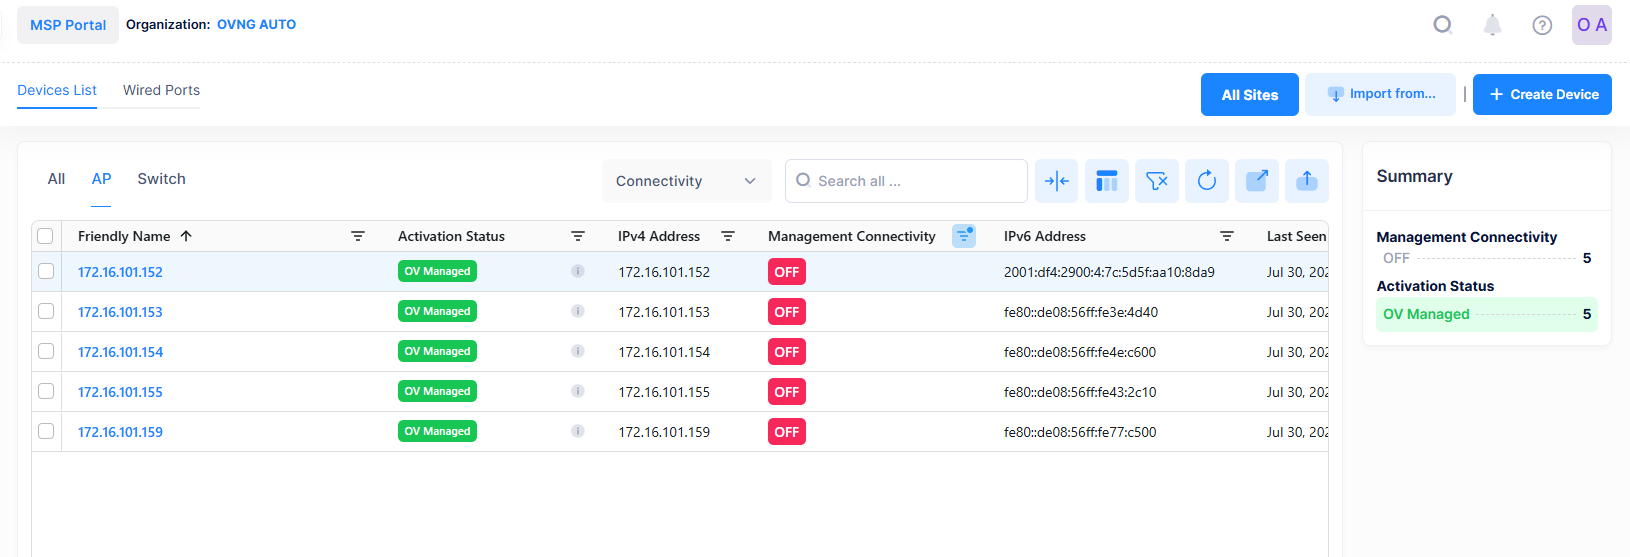
Access Points Down Count
Displays the number of Access Points that are down (Management Connectivity status is Off), as shown below.

When you click on the Access Point Down Counter, you are redirected to the Devices List screen, which displays a list of only those devices that are down.
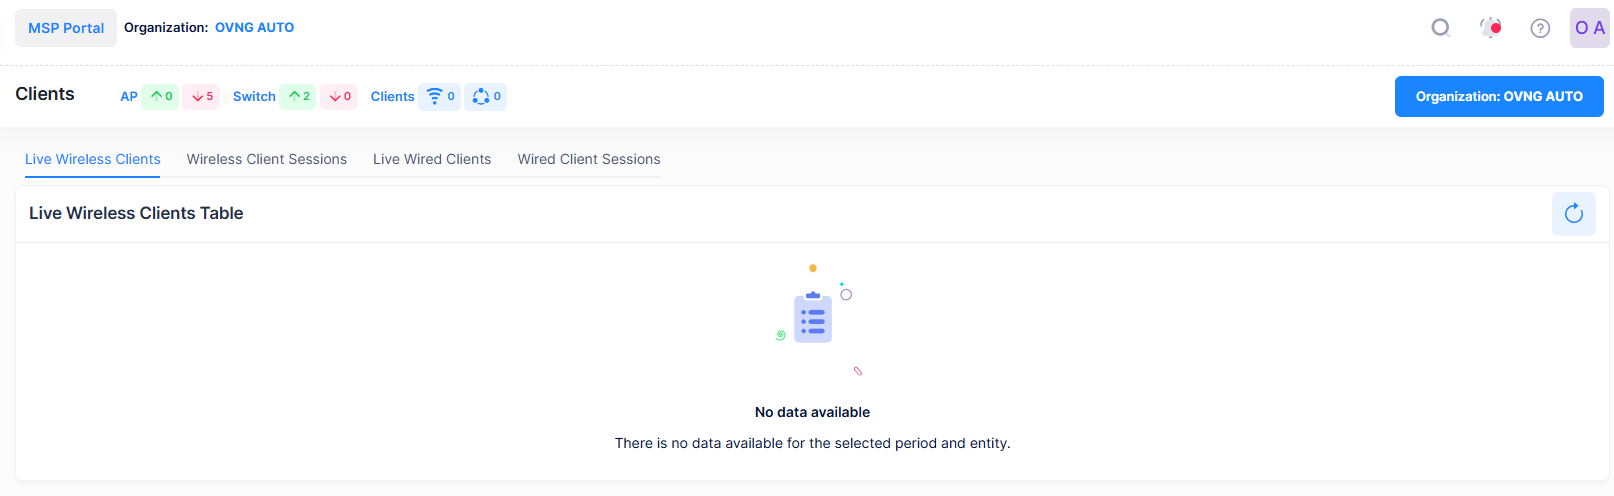
Live Connected Wireless Clients
Displays the number of currently connected Live Wireless Clients in the Network as shown below.

When you click on the Wireless Clients Counter, you are redirected to the Clients screen, which displays a list of Live Wireless Clients that are currently connected to the network.
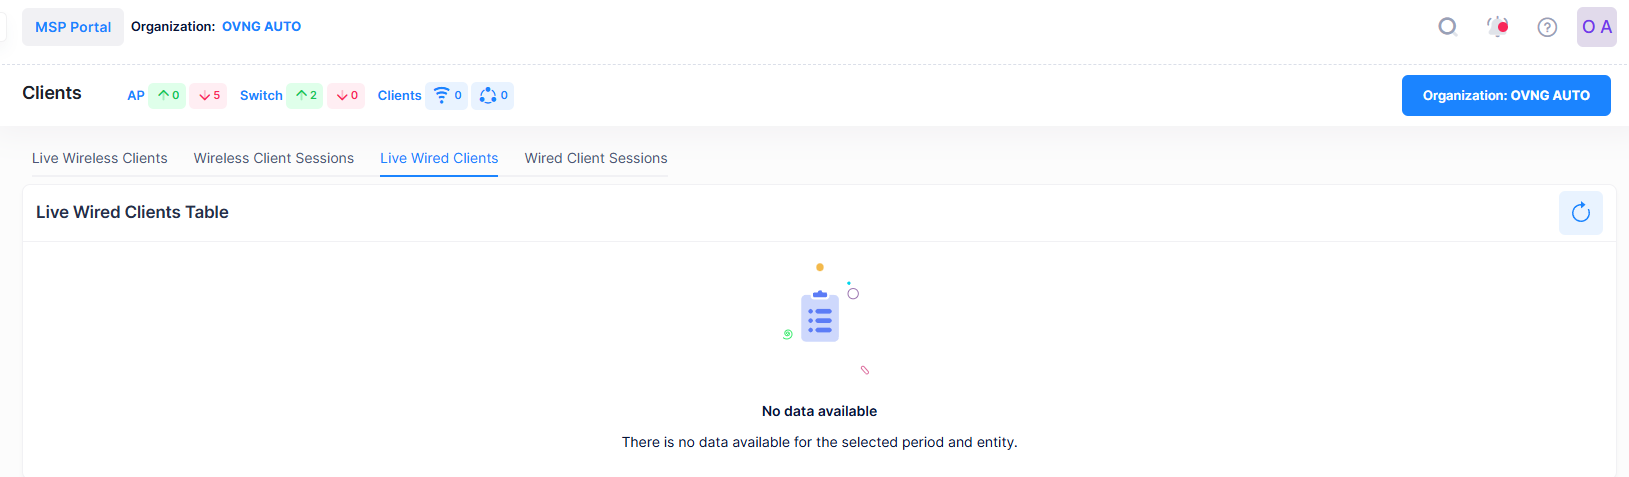
Live Connected Wired Clients
Displays the number of currently connected Live Wired Clients in the Network as shown below.

When you click on the Wired Clients Counter, you are redirected to the Clients screen, which displays a list of Live Wired Clients that are currently connected to the network.
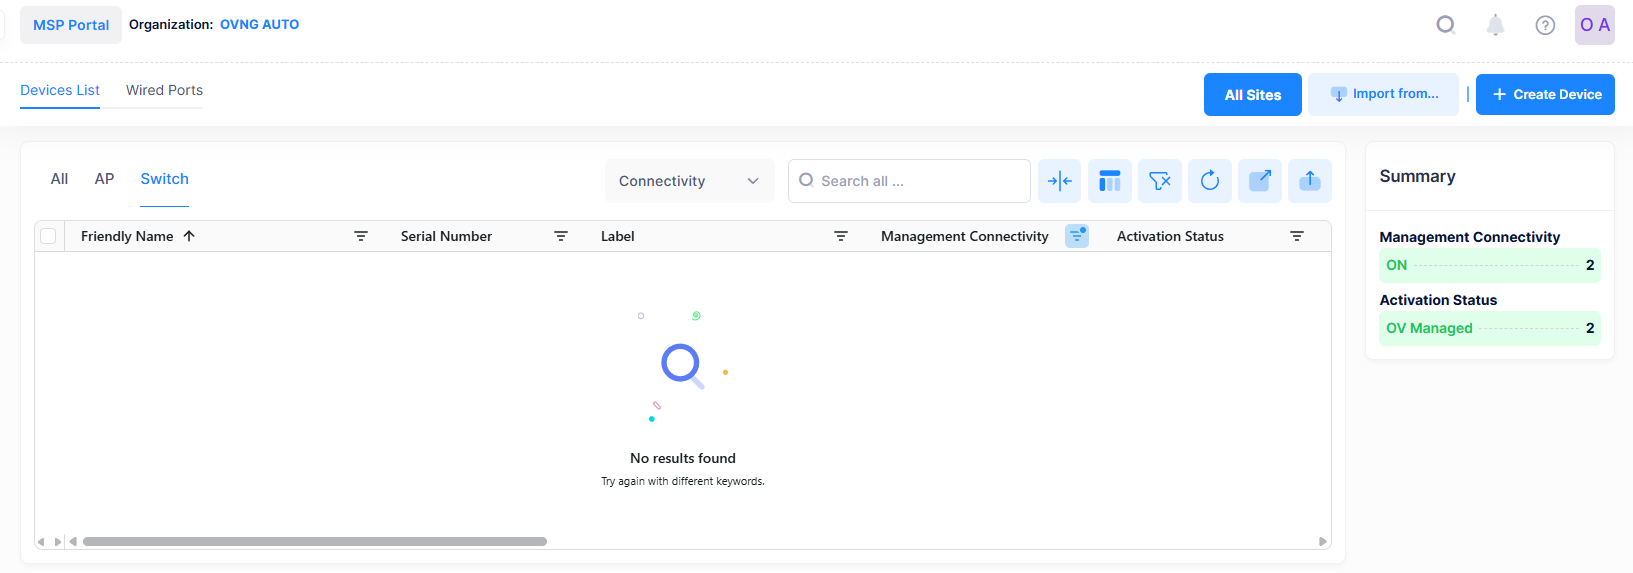
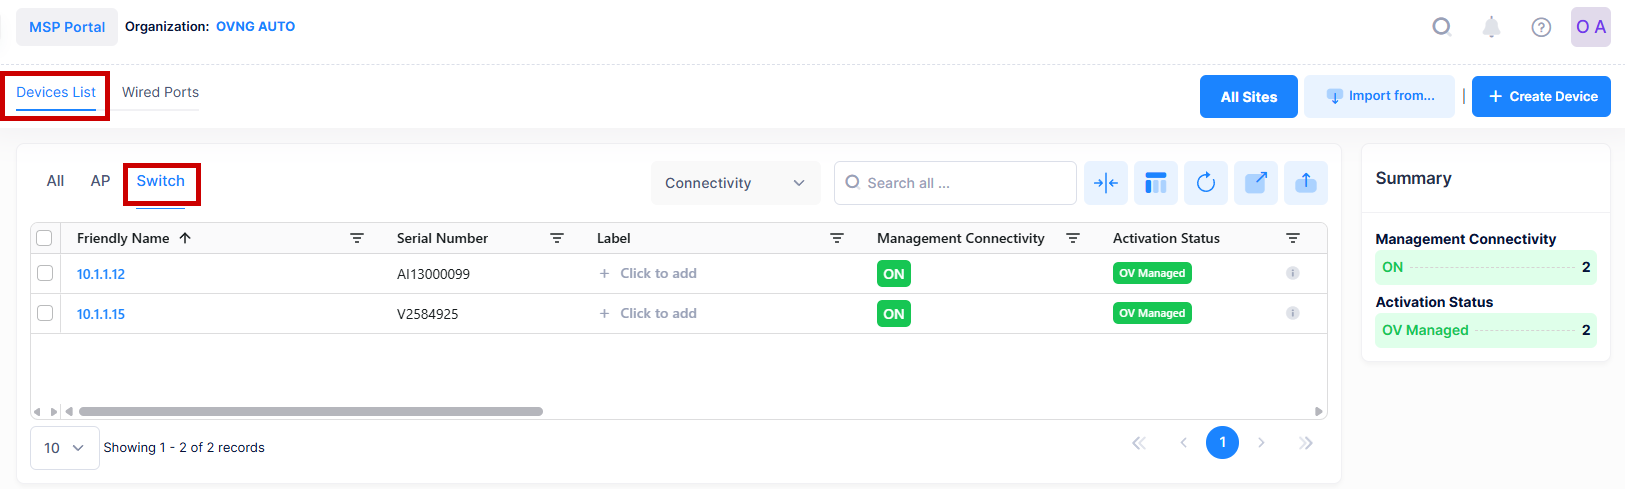
Switch Count
Displays the total number of Switches connected in the Network, as shown below.

When you click on the Switch Counter, you are redirected to the Devices List screen, which displays a list of total switches that are connected to the Network.
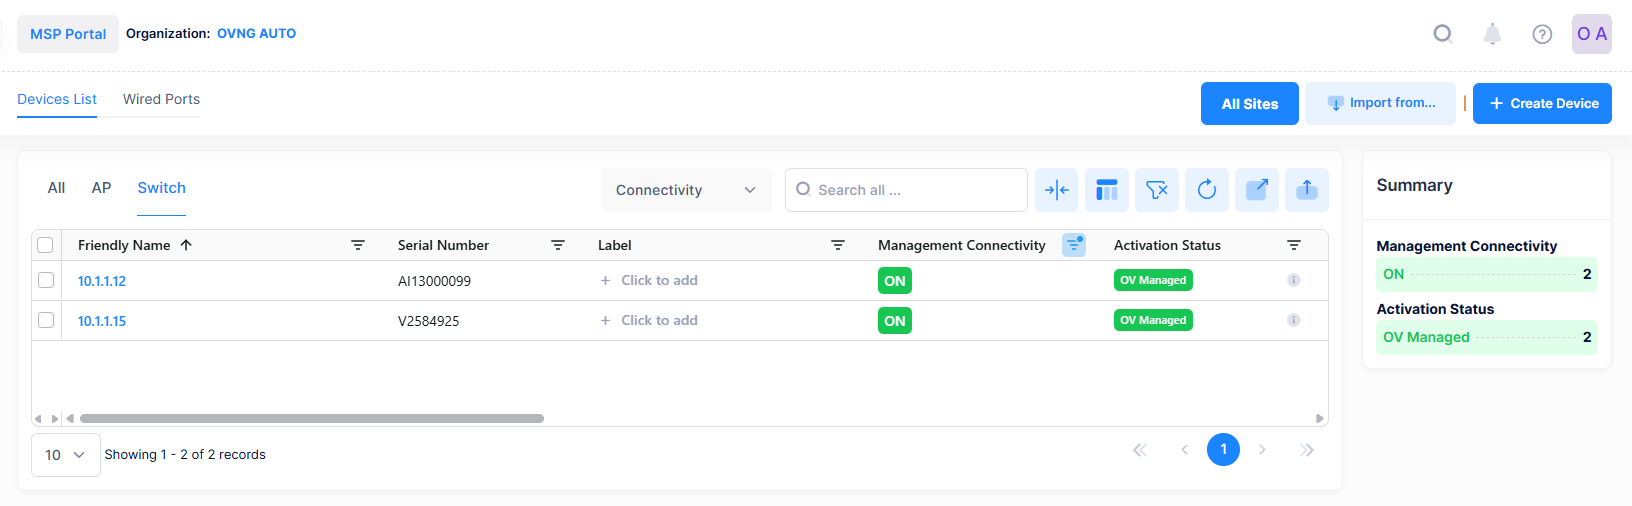
Switch Up Count
Displays the number of Switches that are Up (Management Connectivity status is “On” or “Not Applicable”), as shown below.

When you click on the Switch Up Counter, you are redirected to the Devices List screen, which displays a list of only those switches that are up.
Switch Down Count
Displays the number of Switches that are down (Management Connectivity status is Off), as shown below.

When you click on the Switch Down Counter, you are redirected to the Devices List screen, which displays a list of only those switches that are down.