The Device List section of the Network Analytics Dashboard provides information to help monitor and evaluate the Device or Access Points performance metrics which also includes the Wireless and Wired Clients Device uptime.
Data displayed can be exported into a CSV, PDF or Excel sheet format. You can also switch to full-screen mode for a better display.
By default, all devices are selected. Click on All, AP, or Switch to view the related device detailed performance.
From this screen, you can perform any of the following actions:
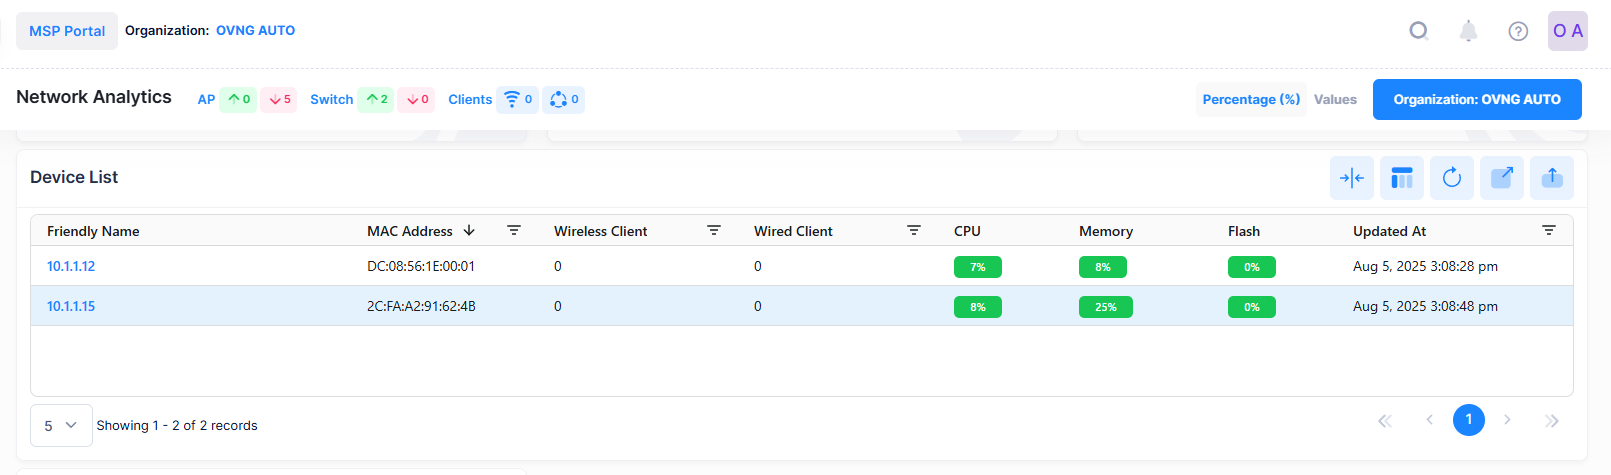
The Device List field values provide the following information:
-
Friendly Name - The name assigned to the device is derived from the Preferred Device Naming convention specified in the user preference settings. By default, the Friendly Name is set to IP Address (System Name).
-
MAC Address - The Access Point MAC address.
-
Wireless Client - The number of Wireless Clients connected to the Access Point.
-
Wired Client - The number of Wired Clients connected to the Access Point.
-
CPU - The CPU Usage of the Access Point device.
-
Memory - The Memory Usage of the Access Point device.
-
Flash - The Flash Usage of the Access Point device.
-
Updated At - The time of the last event received from the Access Point that was used to calculate the Uptime or downtime.
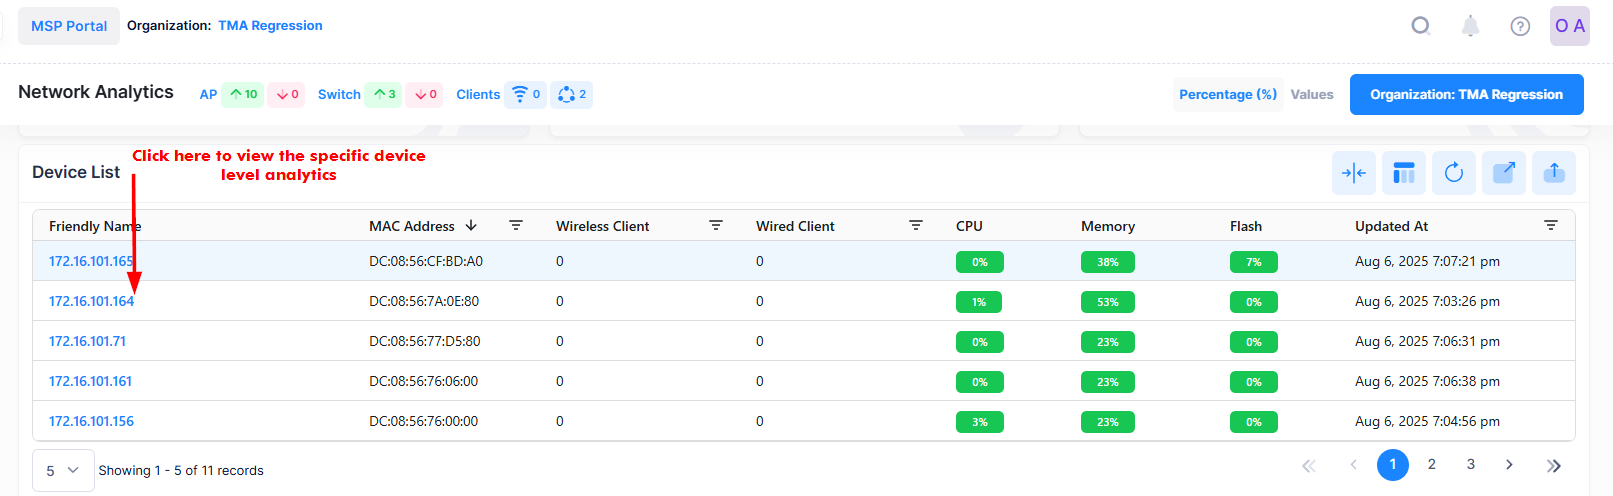
Note: The Device List table displays only those Access Points or Switches which are fully connected and managed with OmniVista Cirrus 10 services. The Devices must be sending the Analytics data and it should not be disabled by the user. The Access Points which are not active will not be displayed here.
To explore specific Device Level Analytics, click on the specific ‘Friendly Name’ in the Device List Table to view the detailed Analytics of a particular Access Point or Switch device as shown below.
The Device level Network Analytics screen displays filters on the dashboard to define the scope of activity that you want to monitor within a specific window of time.
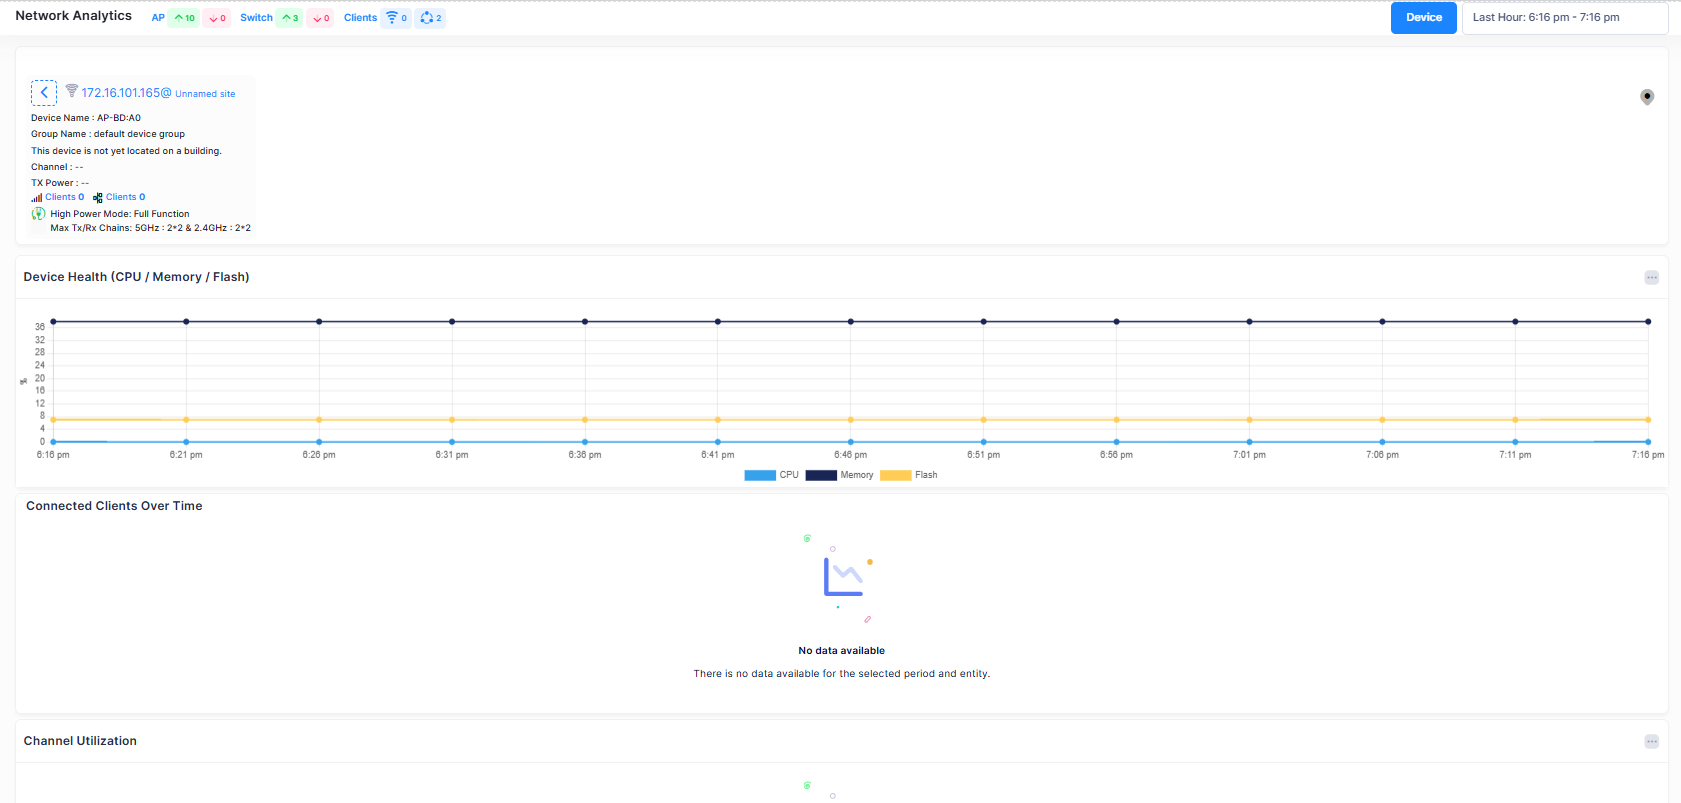
Note: The ‘Current’ Access Point Uptime and Downtime with the count of Live Wireless and Wired Clients connected and other Network Analytics is shown as a summary at the top and the ‘Historical’ charts are displayed below the Summary view.