The Network Analytics Dashboard provides an overview of WLAN and Wired metric values for Access Points and Switches. The scope of Access Points or Switches to monitor is defined using the display filters to specify an entire organization, site, building, or a set of Access Points. To access the Network Analytics Dashboard, click on Analytics > Network Analytics under the “Monitor” section of the OmniVista Cirrus Menu.
There are three options available to monitor the Network Analytics from this screen:
-
All - Displays Analytics of all devices (Access Points and Switches).
-
AP - Displays Analytics of Access Points.
-
Switch - Displays Analytics of Switches.
By default, All devices are selected. Click on All, AP, or Switch to view the related device performance analytics.
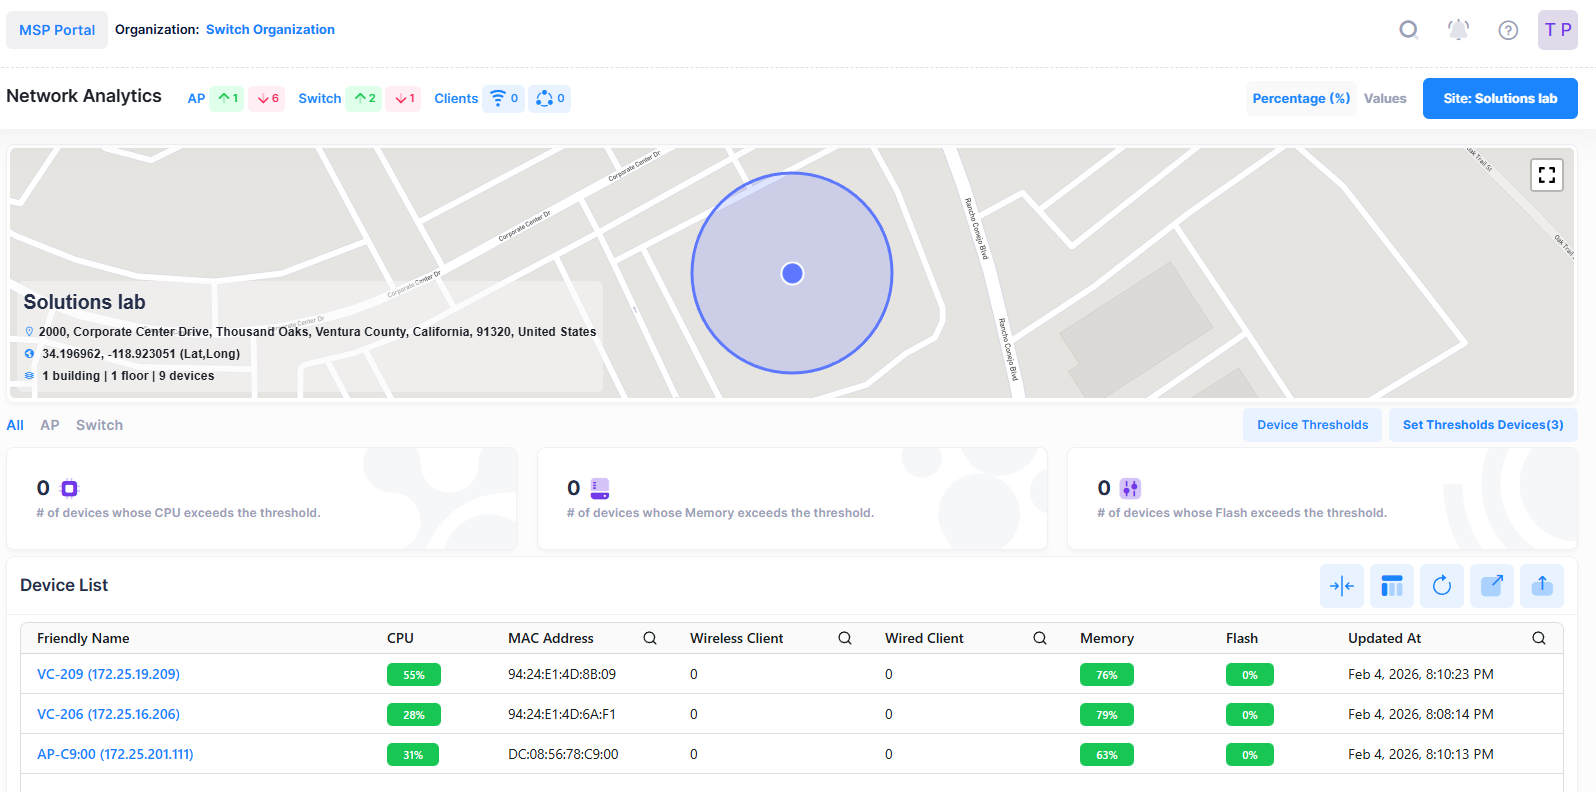
Use the Network Analytics Dashboard to monitor and evaluate the following metric values:
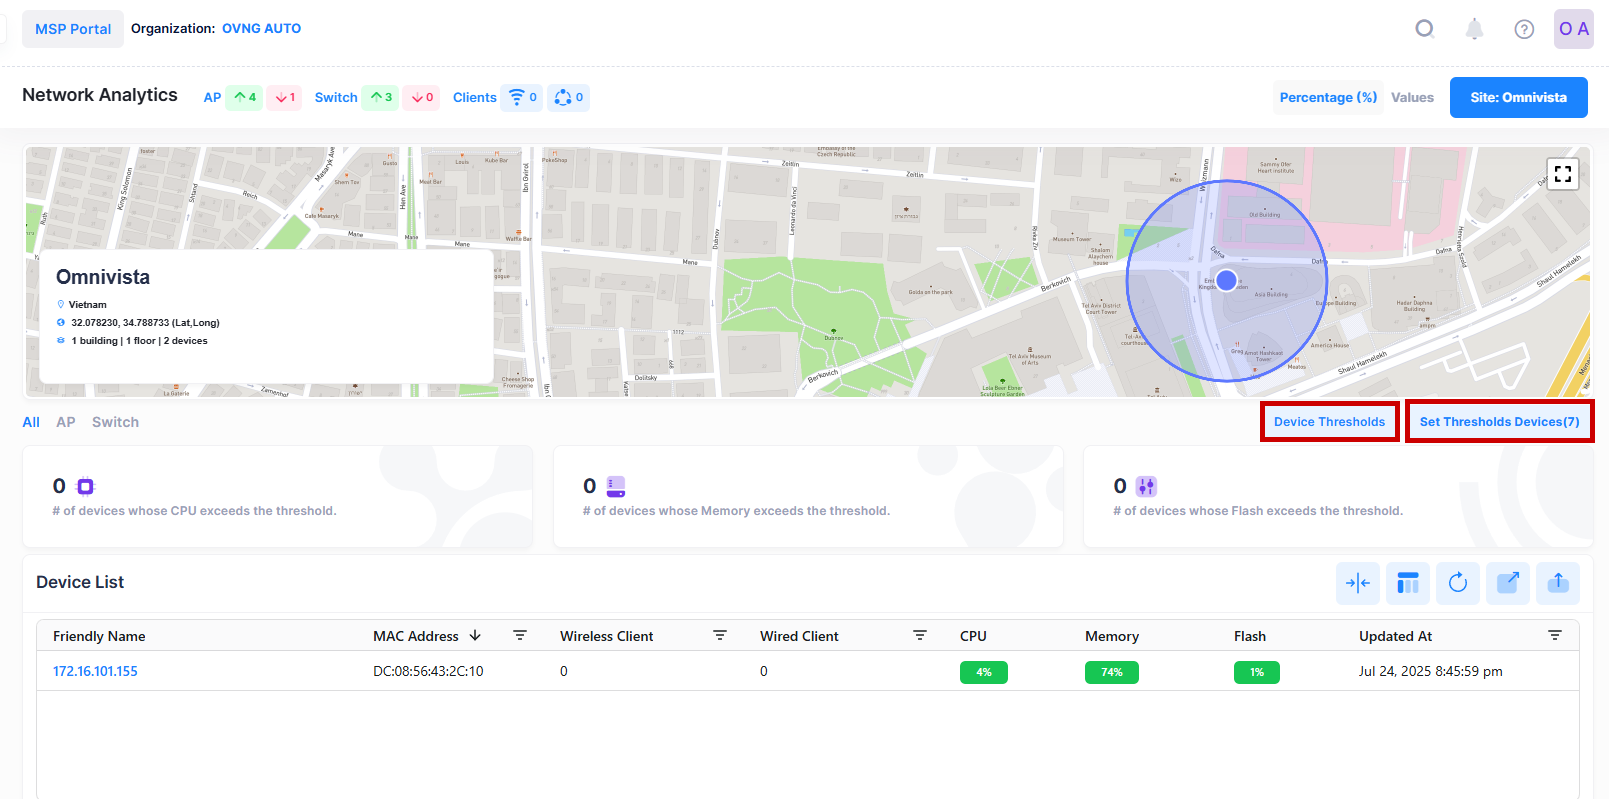
Use the Device Thresholds and Set Thresholds Devices metrics to configure and evaluate the Access Points and Switches Health threshold values. The CPU and memory health threshold values are configurable for a specific Access Point device; the CPU, memory, and flash health threshold values are configurable for all Access Points and Switches associated with a specific Site. Note that device threshold values take precedence over Site threshold values. See the Configure Network Analytics Thresholds online help for more information.
Use the Access Points and Switches Health metrics to watch for sustained usage that is close to the threshold values and identify peak usage rates.
Note: Changing any of the default Site or device threshold values will recalculate all three parameters of the Access Point Health dashboard and will change the threshold line in the Access Point Health Table. It is used to count number of healthy Access Points that are available now corresponding to the new threshold values.