Network Analytics are computed based on usage threshold values configured at Organizational level and Site level. To change a usage threshold value, click on the respective button on the Network Analytics Dashboard as described below.
The Network Analytics Summary at the top of the dashboard displays the total number of Access Points, Access Points Up, Down Count, number of Live Wireless and Wired Clients connected in the Network, total number of Switches, Switches Up and Down Count.
Configure Device Health Thresholds for Access Points
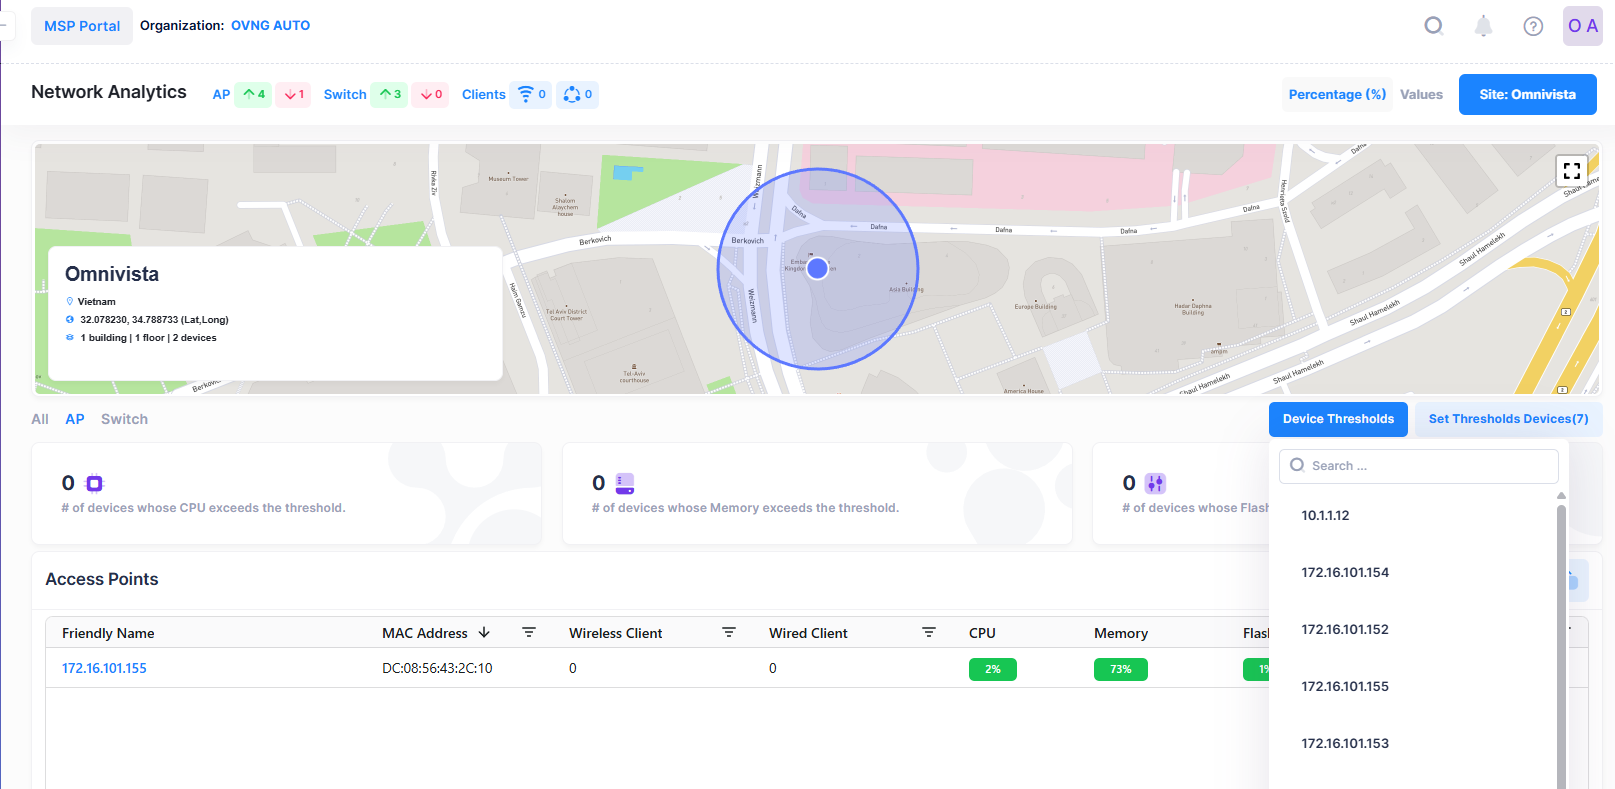
The Access Points Health analytics for CPU, Memory and Flash Health metrics can also be computed based on Device threshold values of the devices. The Device Thresholds button appears when you selects an Organization level/Site level/Building level or Floor level to view the Access Points Health.
To set a device threshold for the Access Points, click on the Device Thresholds button on the Access Points Health Dashboard. This opens the window in which you can select the Access Points for which you want to edit the threshold values.
When you click on one of the Access Points, it opens the “ Edit Health Thresholds” window from which you can edit the following threshold values for the Device:
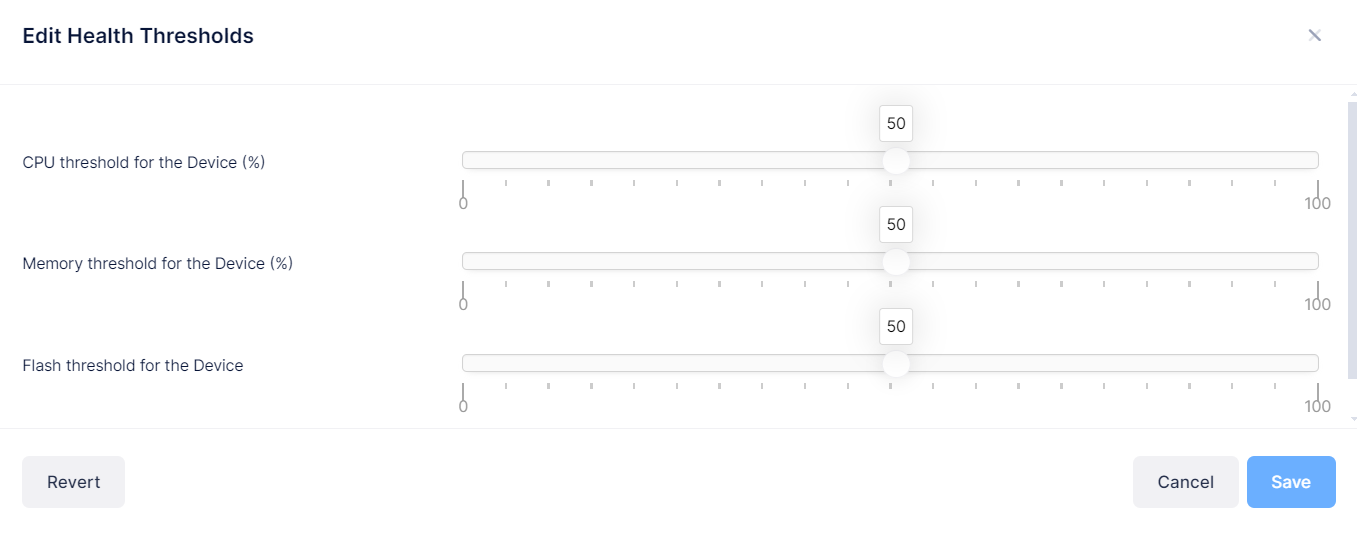
After changing any of the threshold values, click the Save button. To revert thresholds to their default values, click the Revert button.
Configure Device Health Thresholds for Switches
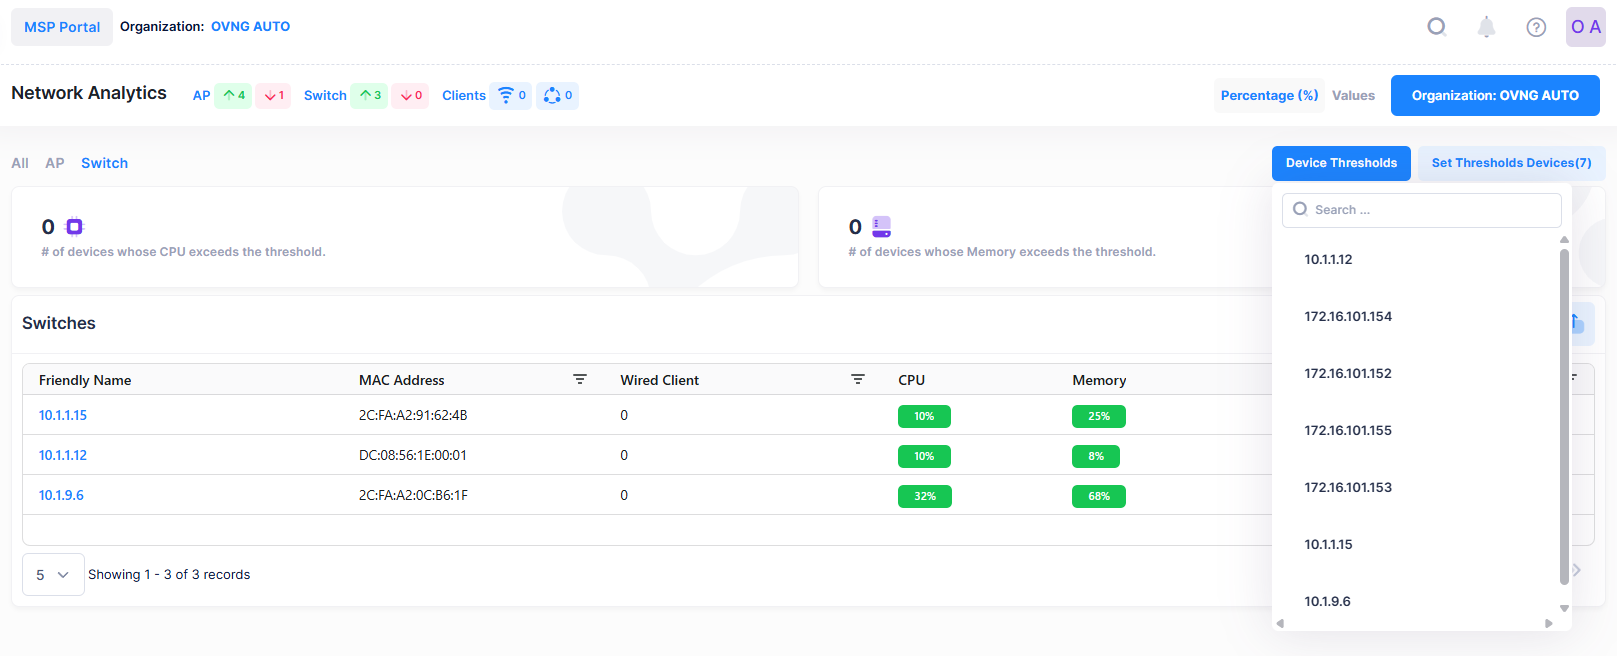
The Switches Health analytics for CPU, Memory and Flash Health metrics can also be computed based on Device threshold values of the devices. The Device Thresholds button appears when you selects an Organization level/Site level/Building level or Floor level to view the Switch Health.
To set a device threshold for the Switch, click on the Device Thresholds button on the Device Health Dashboard. This opens the window in which you can select the Switch/device for which you want to edit the threshold values.
When you click on one of the Switch IP, it opens the “ Edit Health Thresholds” window from which you can edit the following threshold values for the Device:
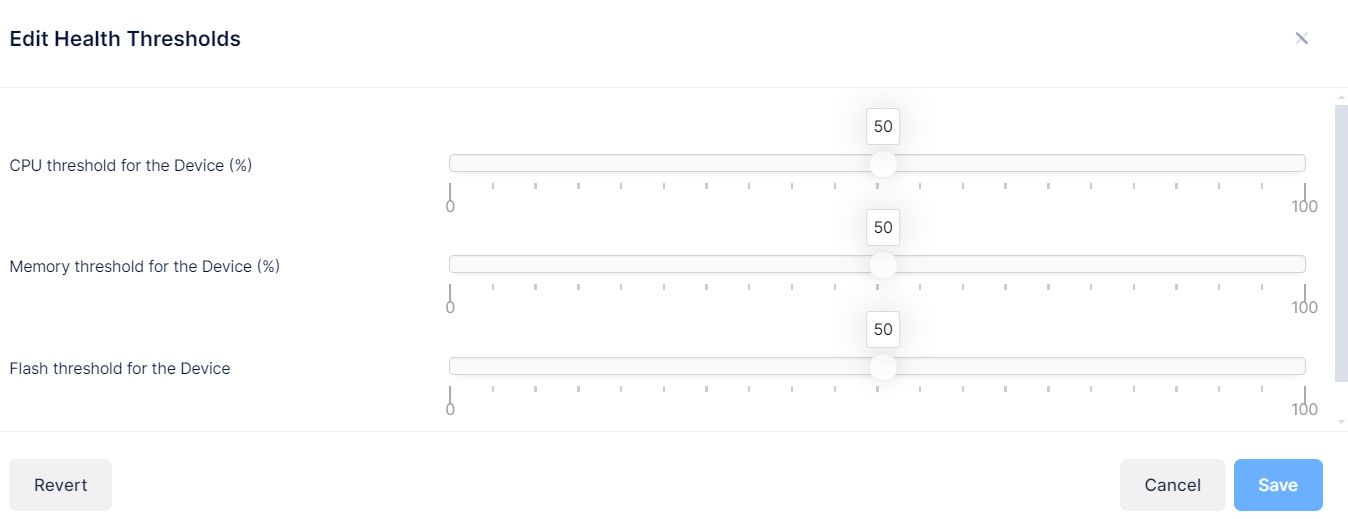
After changing any of the threshold values, click the Save button. To revert thresholds to their default values, click the Revert button.
Set Health Thresholds for multiple Devices
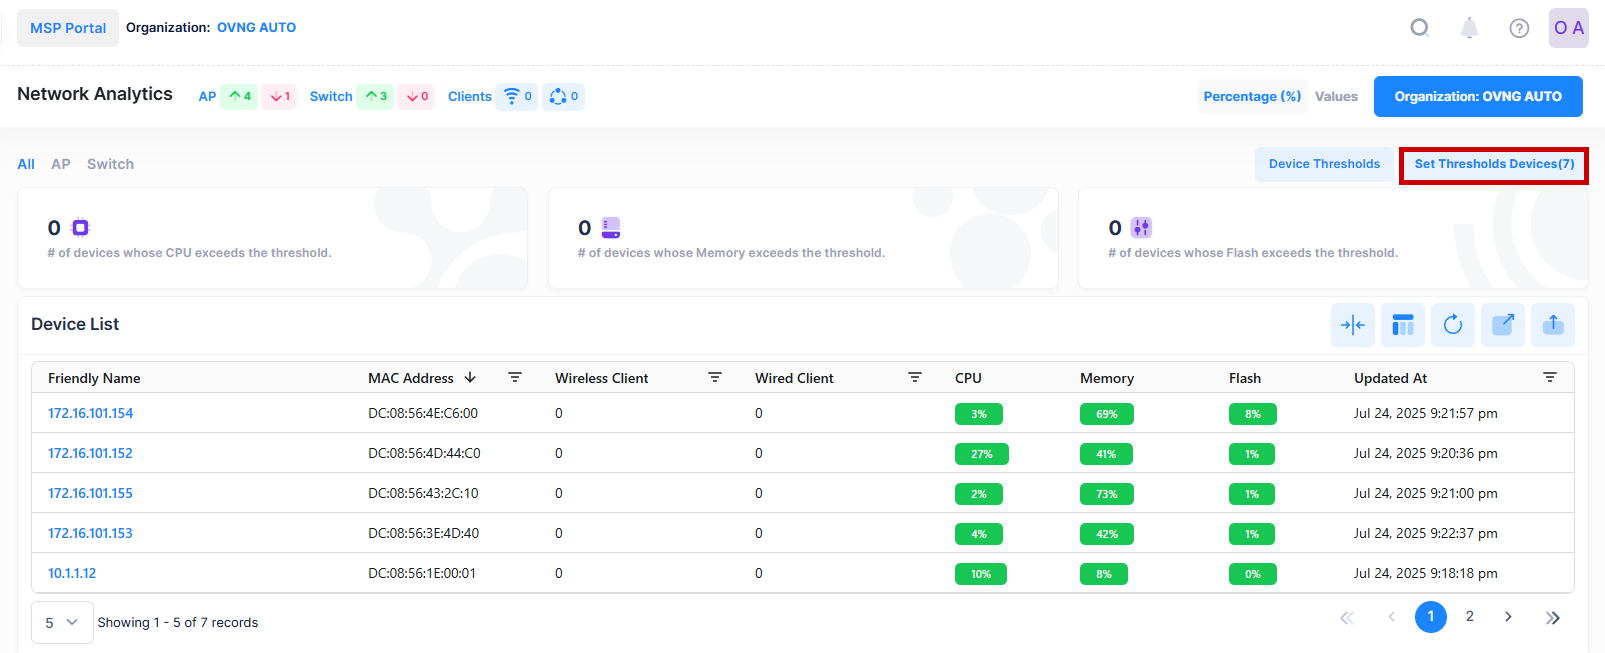
To set the same thresholds for multiple devices simultaneously you can click on the Set Thresholds Devices button. The Set Thresholds Devices button appears next to the Device Thresholds button when you are looking at a specific Site or Organization to view the Device Health as shown below:
To set same thresholds value for multiple devices for a specific Site, click on the Set Thresholds Devices button. The following screen appears from which you can edit the following threshold values for the Access Points:
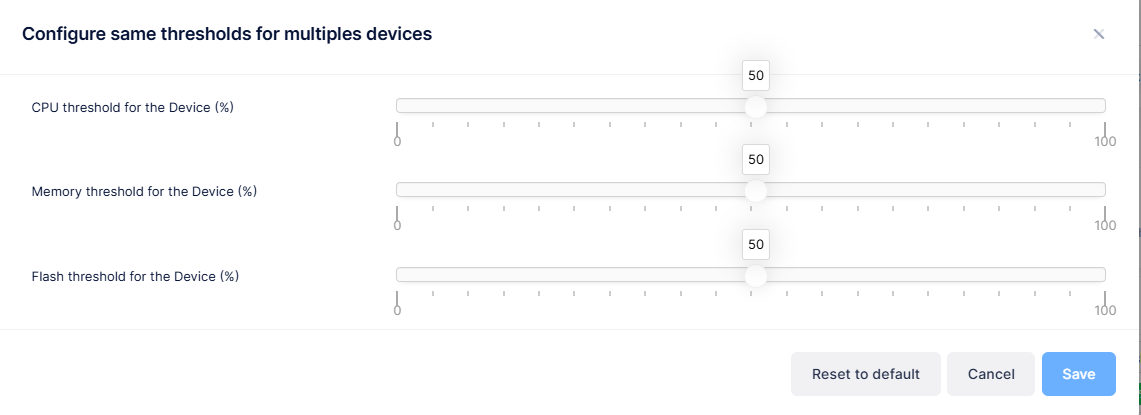
After changing any of the threshold values, click the Save button. To revert thresholds to their default values, click the Reset to default button.
Notes:
-
The Site health threshold is a global threshold that applies to all the devices belonging to that Site. It can be overridden by the device health threshold which is configured with the Device Thresholds option.
-
The Site health threshold is also used to compute the Health Reports for Analytics Reports.
-
OmniVista Cirrus R10 sends the commands to configure the Thresholds on OV managed devices.
-
You can select only one device at a time to configure the Thresholds values.