The Switch Network Analytics section of the Network Analytics Dashboard provides information to help monitor and evaluate the Switches performance metrics.
The top section provides the following information to help monitor and evaluate Device health:
-
The number of devices with CPU usage that exceeds the threshold value.
-
The number of devices with memory usage that exceeds the threshold value.
The CPU and memory health threshold values are configurable for a specific device; the CPU and memory health threshold values are configurable for all devices associated with a specific Site. Note that device threshold values take precedence over Site threshold values. See the Configure Network Analytics Thresholds online help for more information.
Data displayed can be exported into a CSV, PDF or Excel sheet format. You can also switch to full-screen mode for a better display.
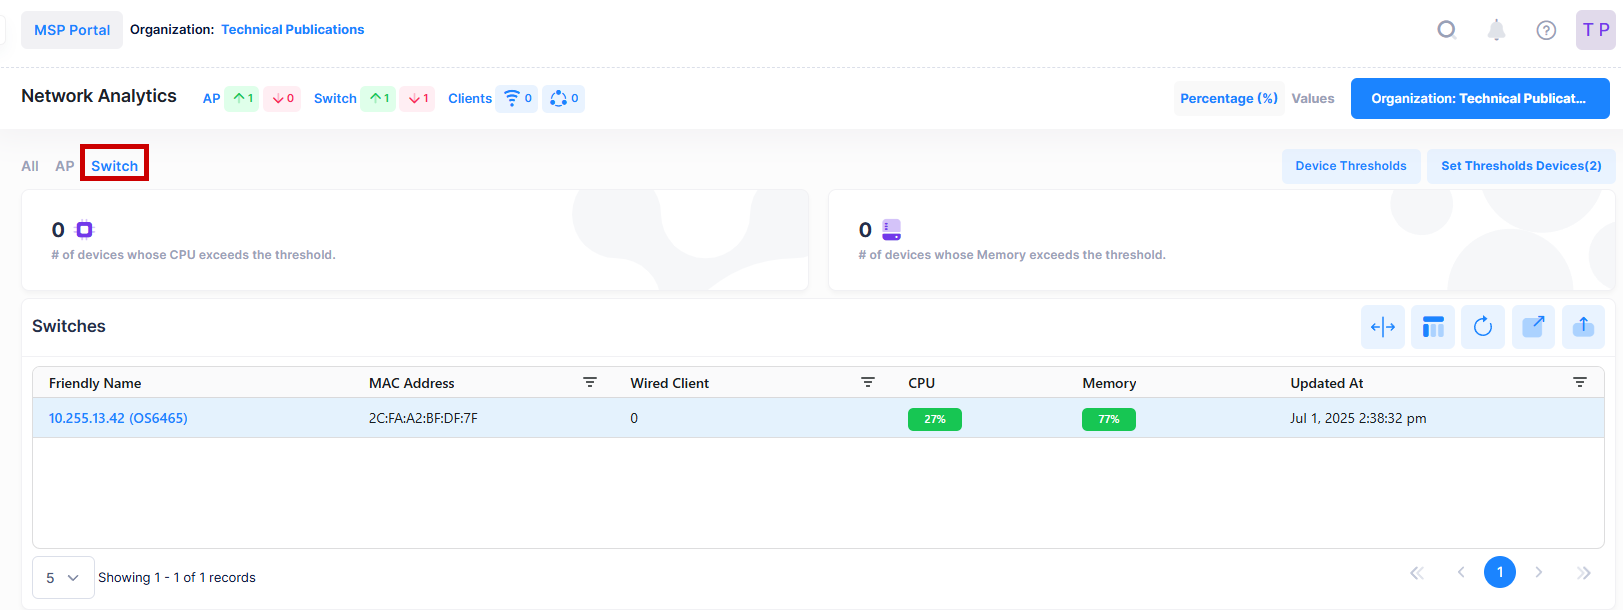
The Switches field values provide the following information:
-
Friendly Name - The name assigned to the device is derived from the Preferred Device Naming convention specified in the user preference settings. By default, the Friendly Name is set to IP Address (System Name).
-
MAC Address - The Switch MAC address.
-
Wired Client - The number of Wired Clients connected to the Switch.
-
CPU - The CPU Usage of the Switch device.
-
Memory - The Memory Usage of the Switch device.
-
Updated At - The time of the last event received from the Switch that was used to calculate the Uptime or downtime.
Note: The Switches table displays only those Devices which are fully connected and managed with OmniVista Cirrus 10 monitoring agent. The Devices which are not active will not be displayed here.
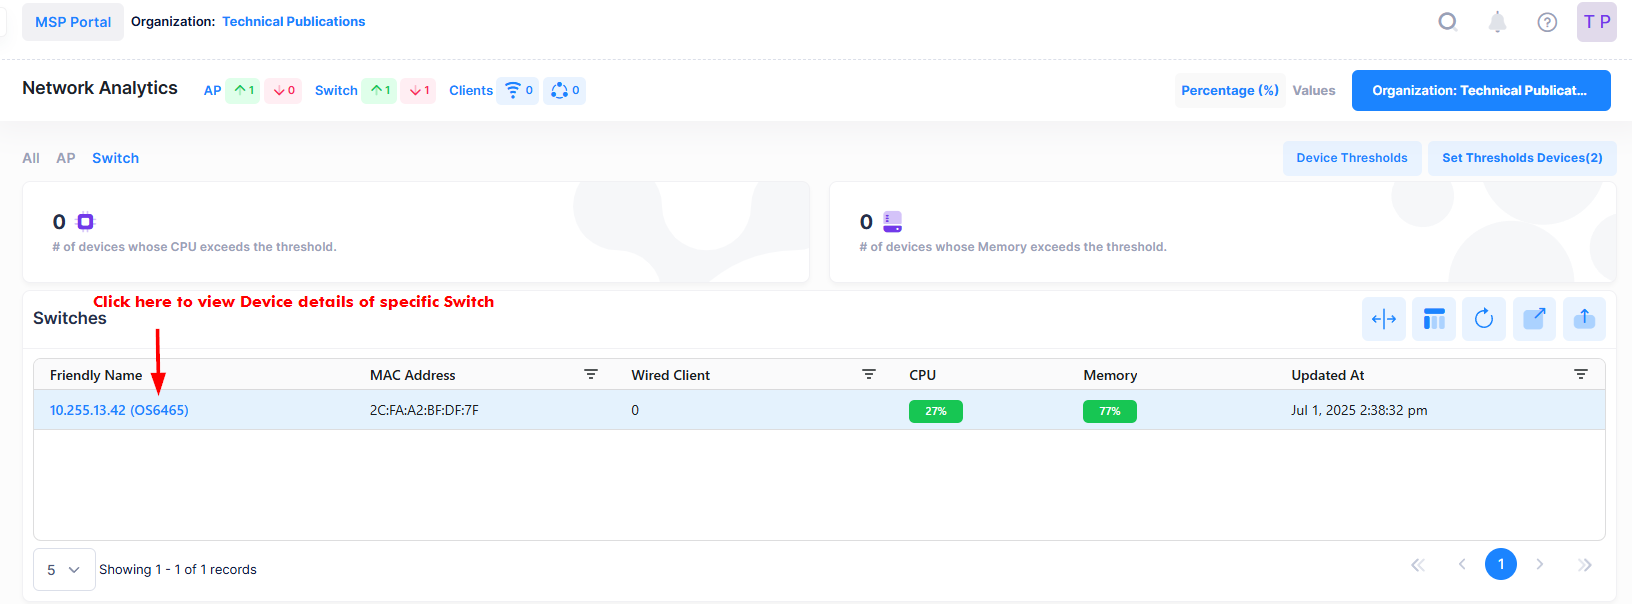
To explore specific Device Level Analytics, click on the specific ‘Friendly Name’ in the Switches Table to view the detail Device Analytics of selected Switch as shown below.
The Switch primary and secondary face plate along with Virtual Chassis slots appears with Switch details like Device Name, Model, IP address, serial number, chassis type and running status and is displayed at the top of the screen as shown below. The Virtual Chassis 1 is selected by default as shown in blue color.
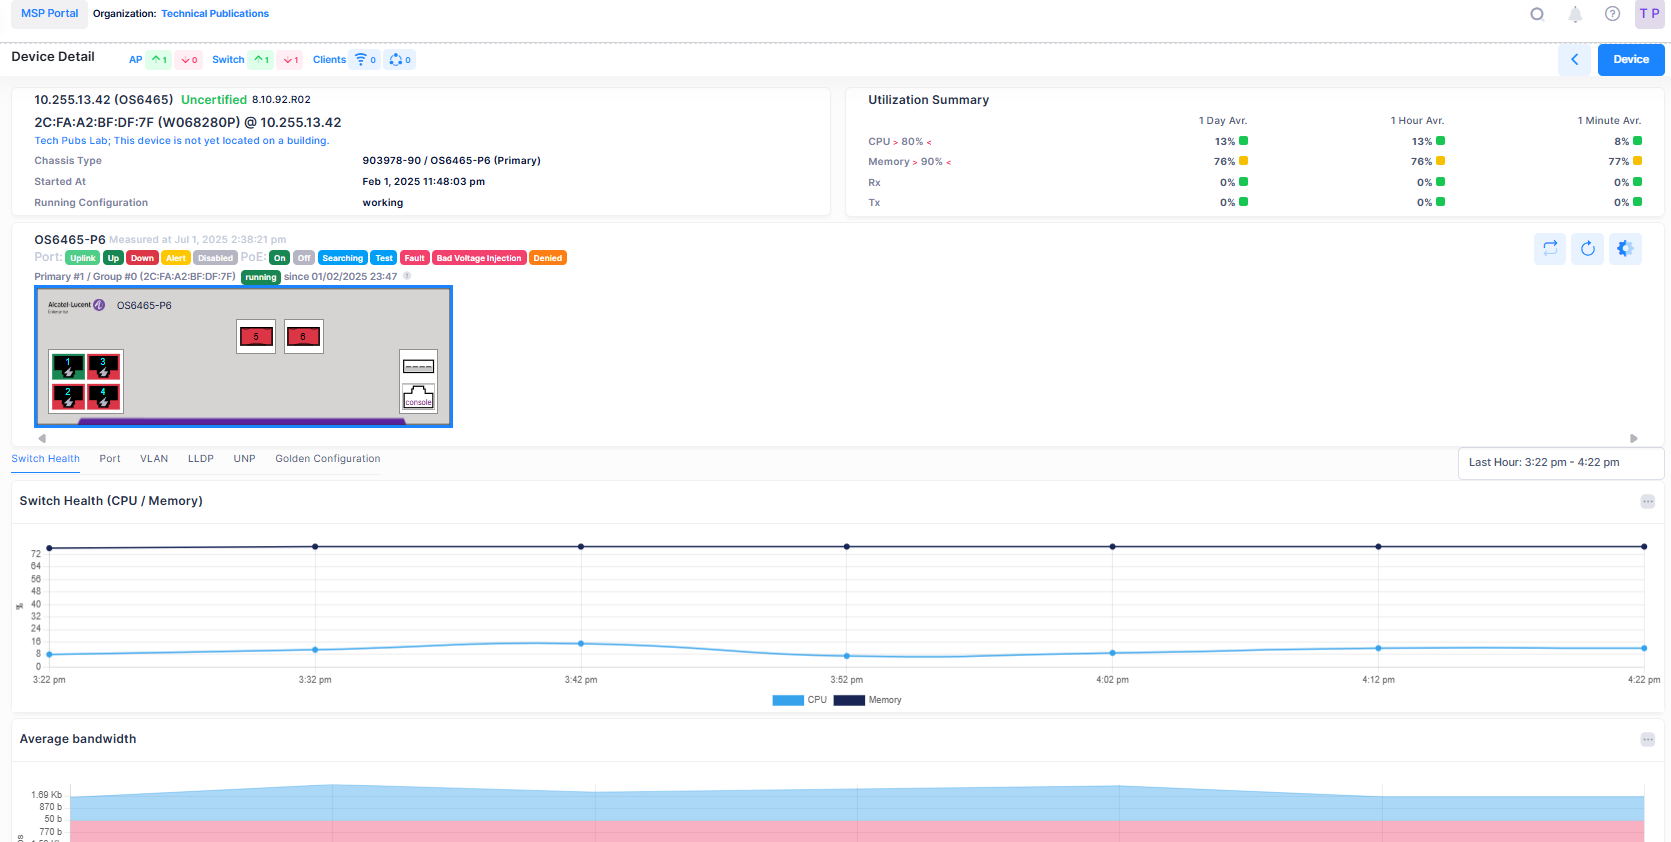
You can click on any of the slot on the Switch faceplate to view the related widget for Switch health performance.
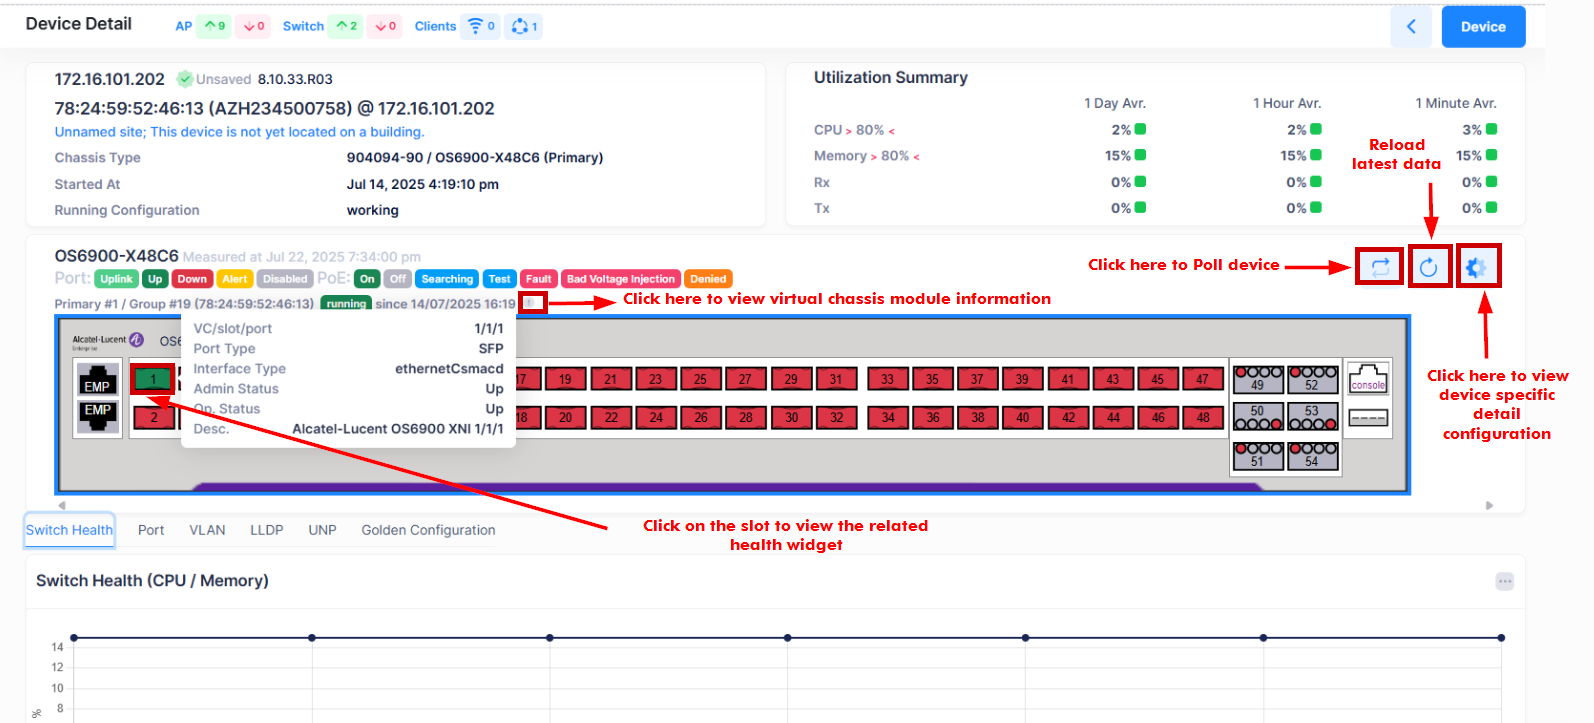
To view device level analytics for another switch without returning to the Network Analytics screen, click on Device in the upper-right corner of the screen. A drop-down list of devices is displayed from which you can select another switch, as shown below.
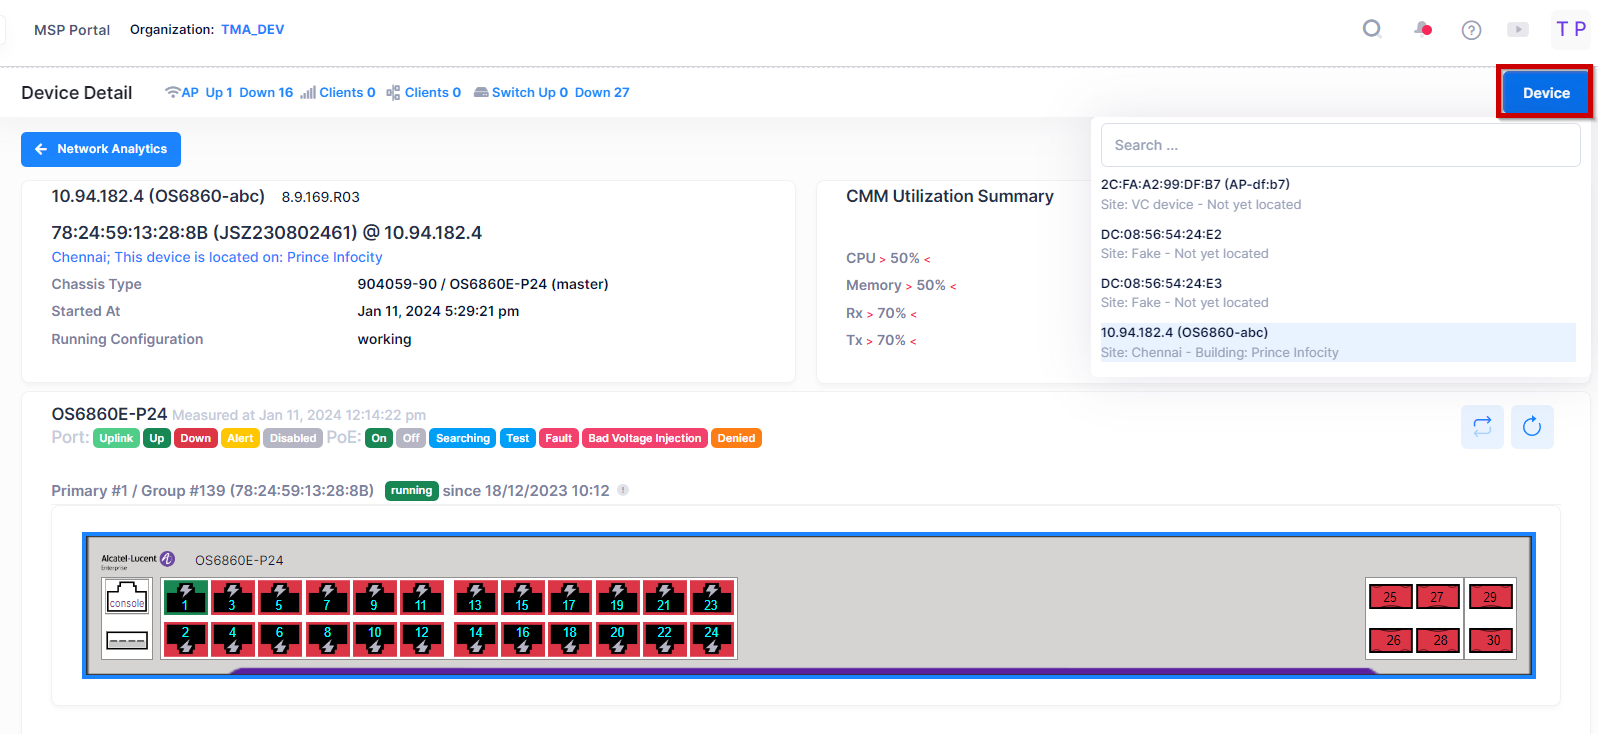
On the Device Detail screen, you can monitor the following parameters using charts and tables to evaluate the Switch Health Trend.
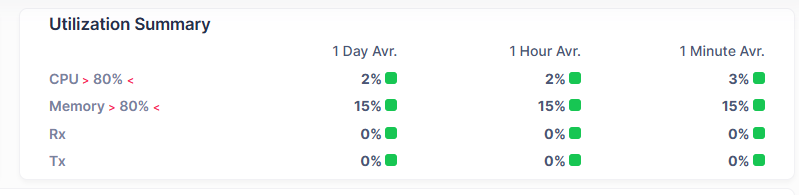
CMM Utilization Summary
The CMM Utilization Summary table at the top-right of the Device Detail screen displays the summary of CPU, Memory, Tx and Rx Average utilization for the Switch.
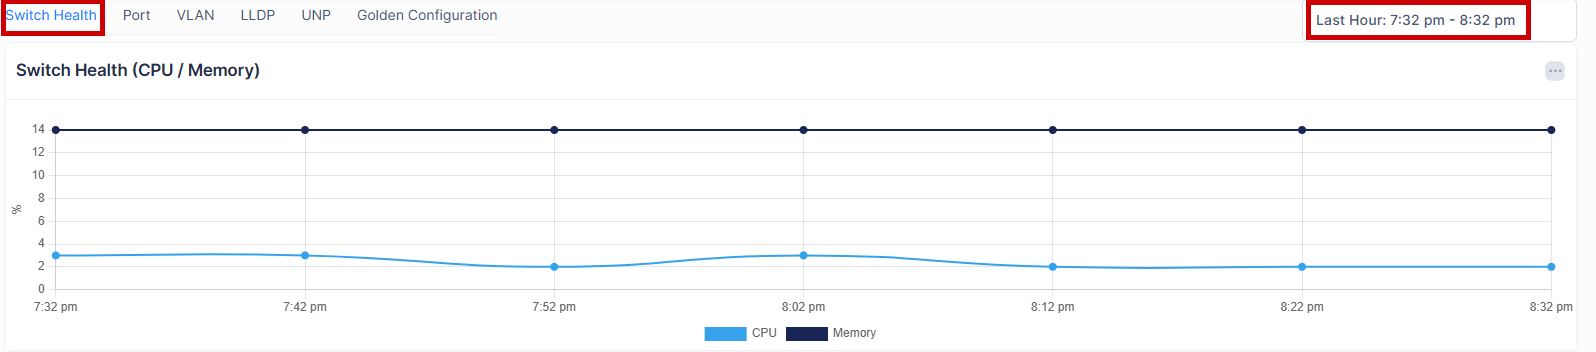
Switch Health
Click on the Switch Health tab at the bottom section of the Device Detail screen to view metrics on the switch CPU/Memory usage and the average bandwidth.
Switch Health (CPU/Memory)
The Switch Health (CPU/Memory) graph is used to evaluate the percentage of Switch CPU and Memory usage for the selected time window range.
Data displayed in the line chart widget can be exported into a CSV or Excel sheet format. You can also switch the widget to full-screen mode for a better display.
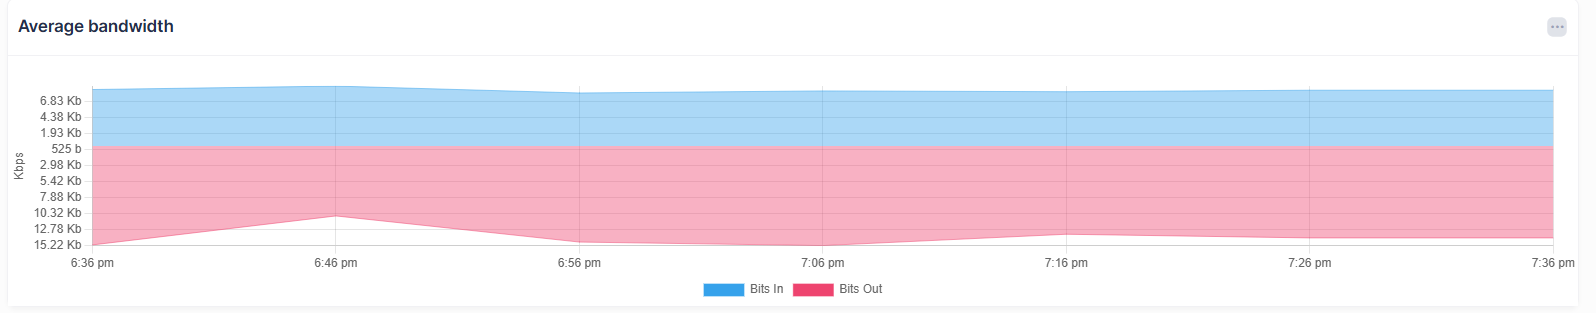
Average Bandwidth
The Average bandwidth section includes a graph representing the number of bytes received and transmitted by Clients to Switch over time.
Data displayed in the bar chart widget can be exported into a CSV or Excel sheet format. You can also switch the widget to full-screen mode for a better display.
Port Level Health and Statistics
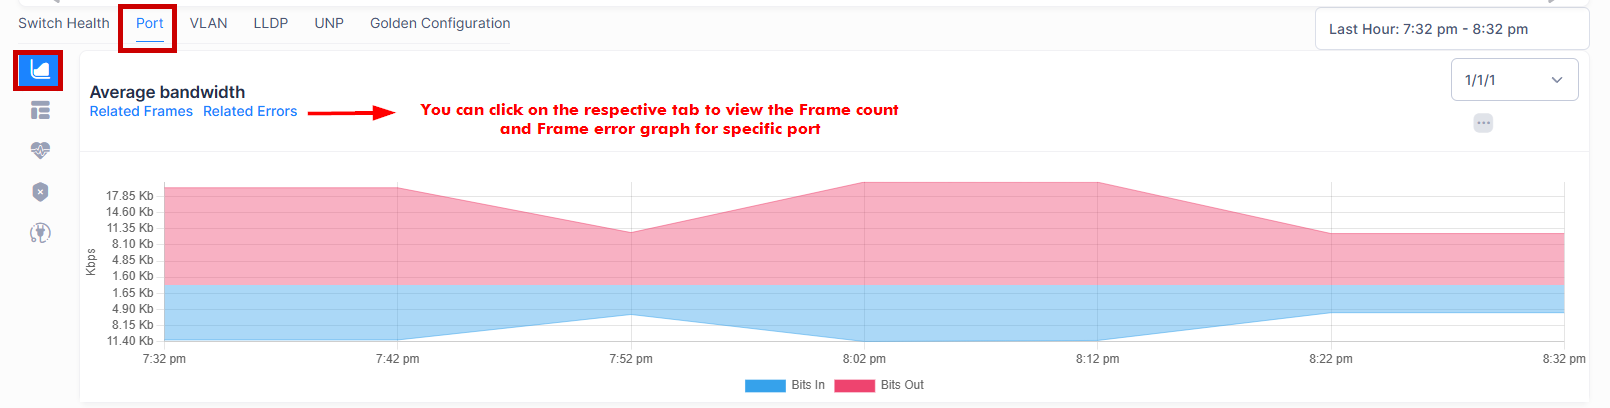
Click on the Port tab at the bottom section of the Device Detail screen to monitor the following parameters during the specified time window range.
By default, the Average bandwidth graph is displayed which represents the Bytes-in and Bytes-out counter of the Switch over the selected time range. The graph displays the health of the 1/1/1 port by default. However, you can select another port from the drop-down list to view the health analytics of another port.
You can also view the other related charts from this screen as shown below.
Data displayed in each widget can be exported into a CSV, PDF or Excel sheet format. You can also switch the widgets to full-screen mode for a better display.
-
Ports List - Displays the list of active Switch ports and their respective TX and RX Health information.
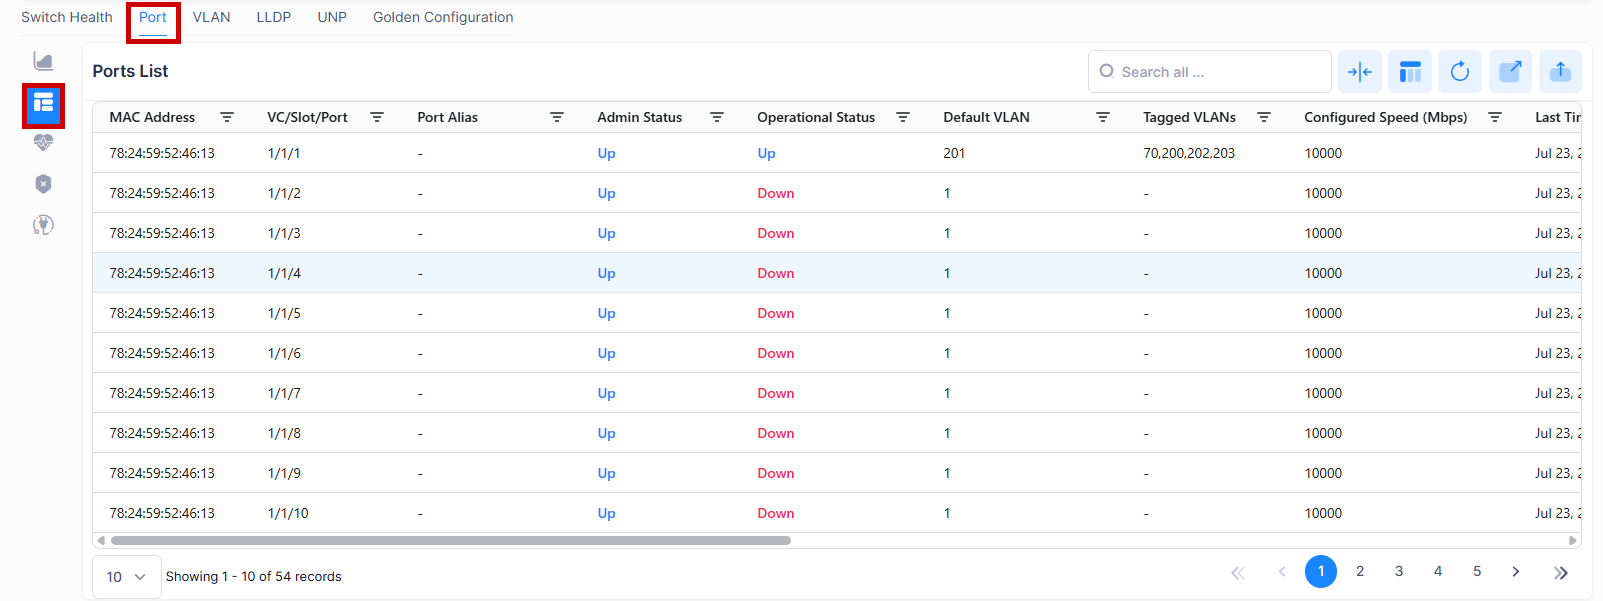
For each Port in the list, the following attribute values are provided:
-
MAC Address - MAC address of the port.
-
VC/Slot/Port - The Virtual chassis/slot/port number.
-
Port Alias - The user-defined alias for the port.
-
Admin Status - Admin status of the port (Up or down).
-
Operational Status - Operational status of the port.
-
Default VLAN - The default Virtual LAN configured on the port.
-
Tagged VLANs - Displays the list of tagged VLANs.
-
Configured Speed (Mbps) - The configured interface line speed, in Mbps. If the port is set to "Auto", the switch automatically sets the line speed to match the attached device.
-
Last time link changed - The last time the configuration for the interface was changed.
-
Number of status Change - The total number of times the configuration of the interface has changed.
-
Negotiated Speed (Mbps) - The actual speed of the port.
-
LAG Port Member - The Link Aggregation Port(s) on the device, if applicable.
-
UNP Name - The Access Role Profile assigned to the port, if applicable.
-
UNP Status - Indicates whether or not UNP is Enabled/Disabled on the port.
-
Port Split Status - The split port status of the switch (Auto, 40GB, or 4 x 10GB). If the port is on a non-supported device, the field will display "False".
-
VFL Port - Indicates whether or not the port is a VFL port (True/False).
-
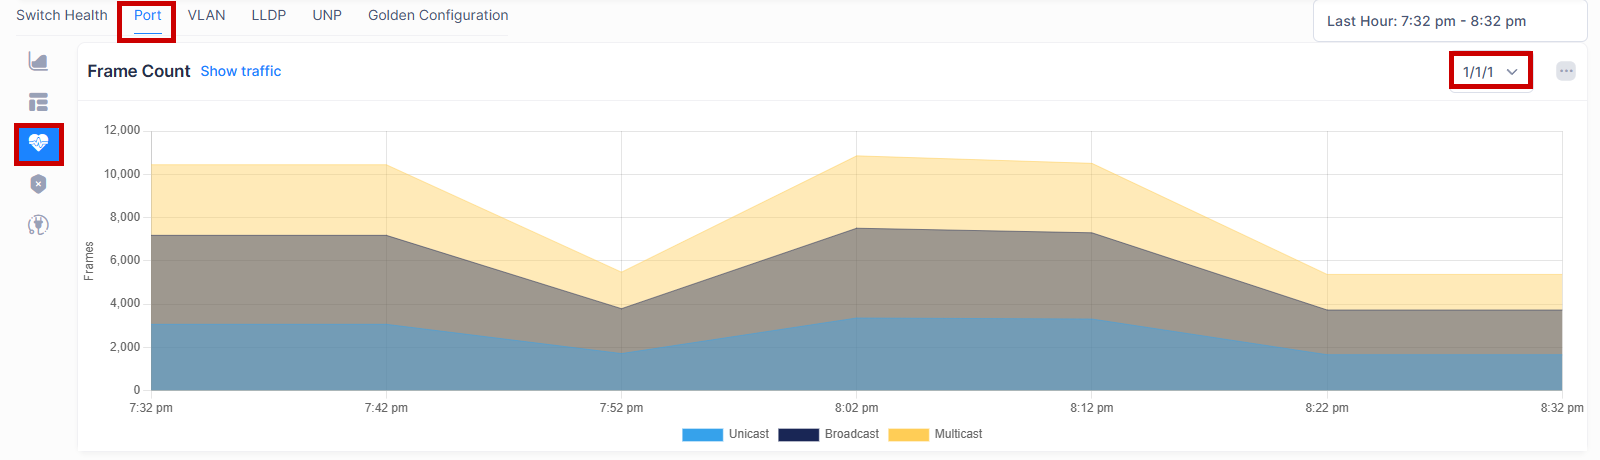
Frame Count - Displays the Unicast, Broadcast and Multicast frame count for the selected port over the selected time range. The health of port 1/1/1 is displayed by default. However, you can select another port from the drop-down list to view the health analytics of another port.
-
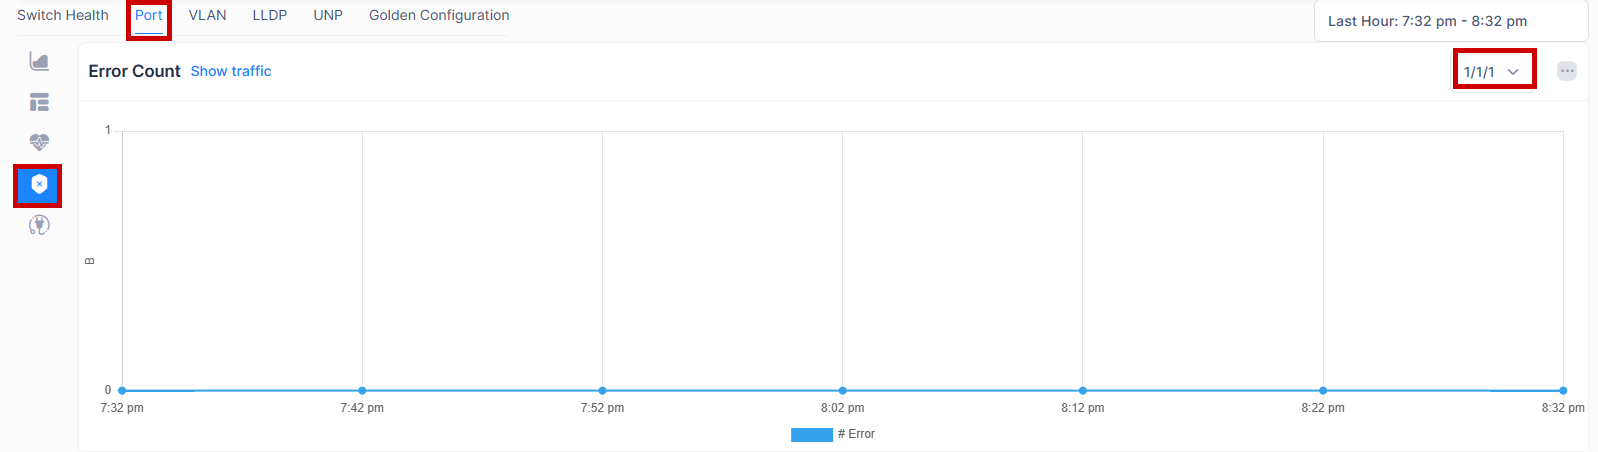
Error Count - The line chart displays the error count for the selected port over the selected time range. It displays the health of the 1/1/1 port by default. However, you can select another port from the drop-down list to view the health analytics of another port.
-
Ports PoE - Displays the list of PoE ports on the Switch.
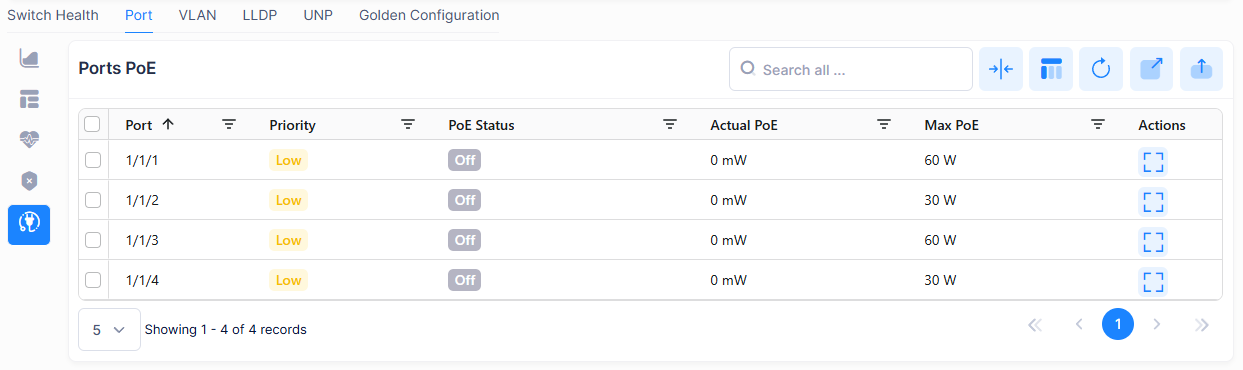
For each PoE Port in the list, the following attribute values are provided:
-
Port - The Virtual chassis/slot/port number.
-
Priority - The priority of the PoE.
-
PoE Status - The status of PoE (Enable/Disable).
-
Actual PoE - The current PoE wattage.
-
Max PoE - The maximum allowed PoE wattage.
Configured VLANs by Port
Click on the VLAN tab at the bottom section of the Device Detail screen to monitor the following parameters during the specified time window range.
Data displayed in each widget can be exported into a CSV, PDF or Excel sheet format. You can also switch the widgets to full-screen mode for a better display.
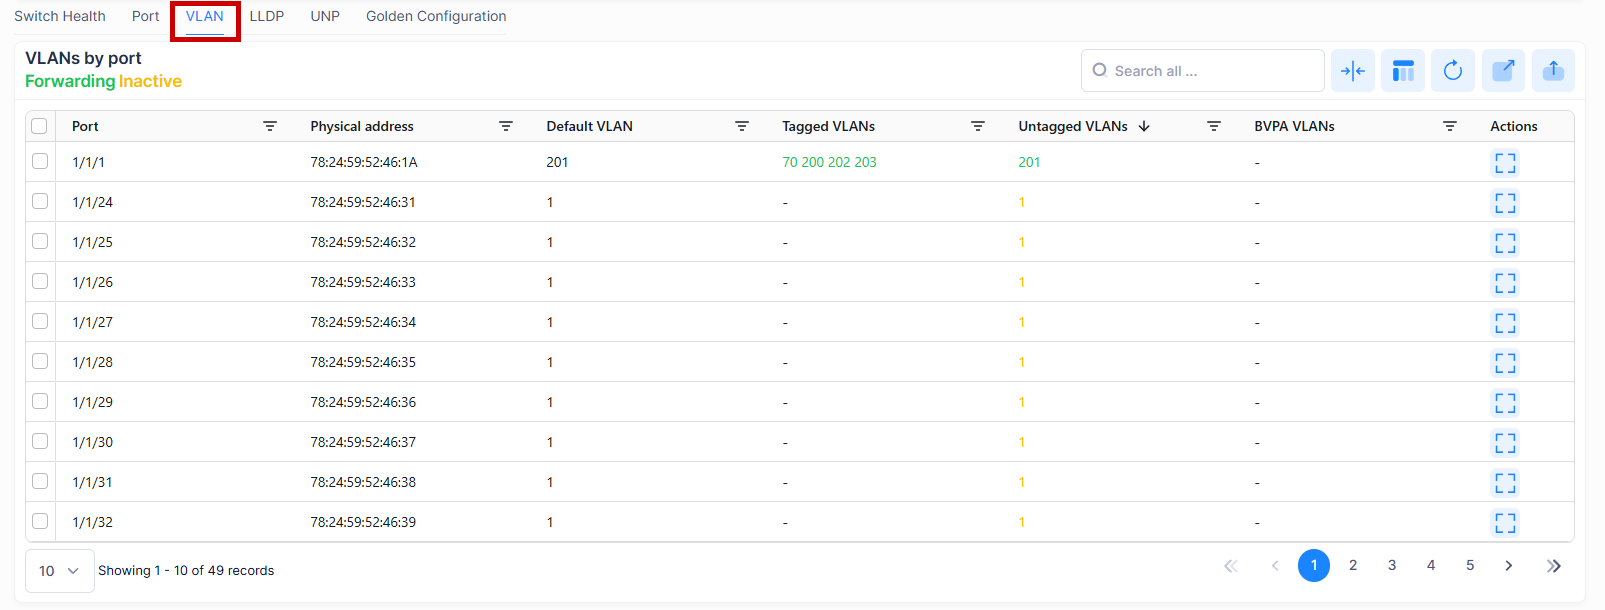
For the VLANs by port in the list, the following attribute values are provided:
-
Port - The chassis/slot/port number of the port.
-
Physical address - The MAC address of the Switch.
-
Default VLAN - The default VLAN configured on the port.
-
Tagged VLANs - The list of tagged VLANs.
-
Untagged VLANs - The list of untagged VLANs.
-
BVPA VLANs - The BVPA VLANs.
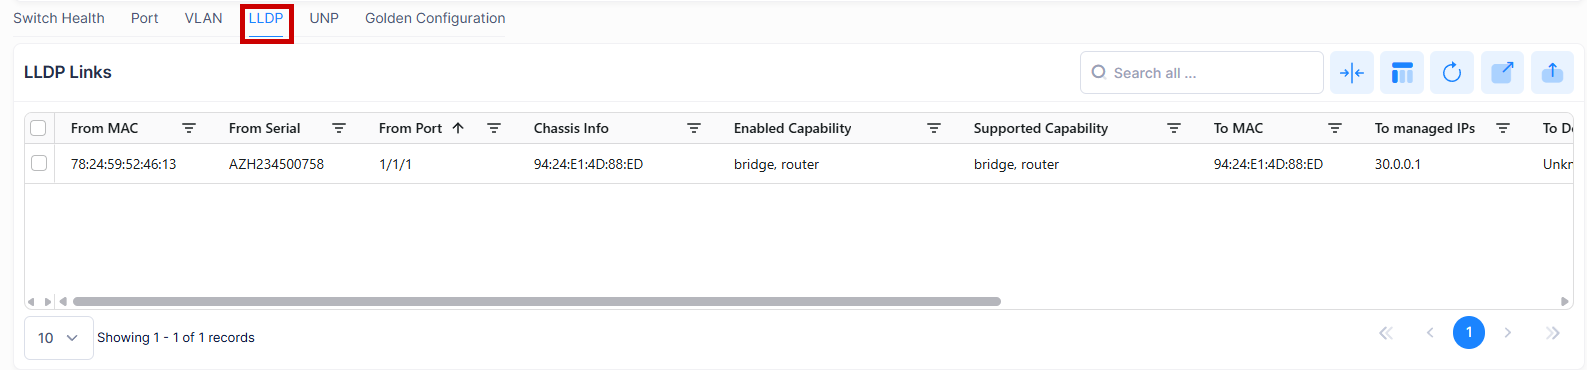
LLDP Links
Click on the LLDP tab at the bottom section of the Device Detail screen to monitor the LLDP connections to the switch.
Data displayed in each widget can be exported into a CSV, PDF or Excel sheet format. You can also switch the widgets to full-screen mode for a better display.
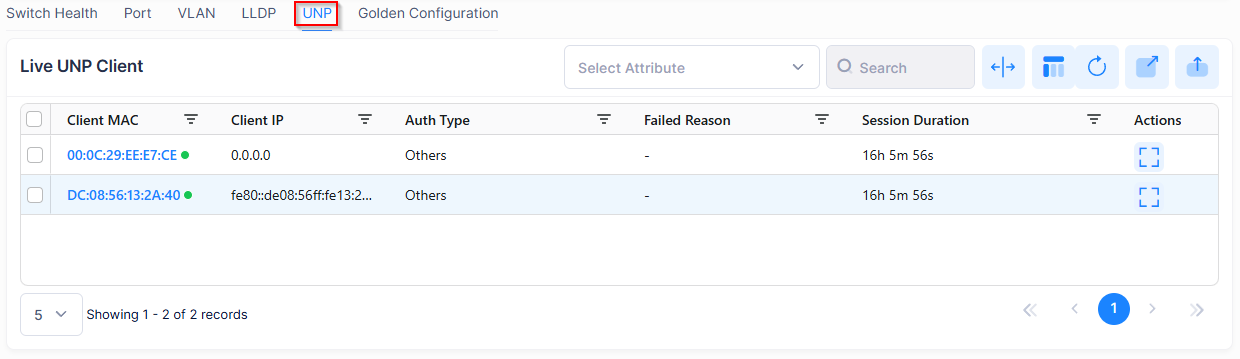
Live UNP Client
Click on the UNP tab at the bottom section of the Device Detail screen to monitor the Live UNP Clients connected to the current Switch.
Data displayed in each widget can be exported into a CSV, PDF or Excel sheet format. You can also switch the widgets to full-screen mode for a better display.
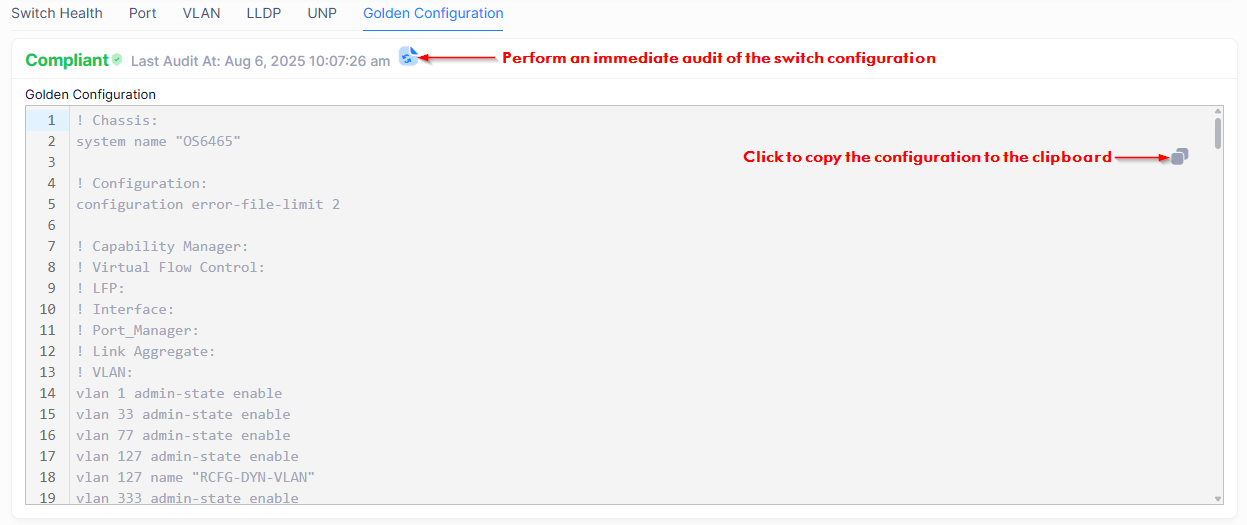
Golden Configuration
Click on the Golden Configuration tab to view the Golden Configuration for the switch. If a Golden Configuration was not designated for the switch, nothing is displayed for this tab.
If there is a Golden Configuration, the following is displayed:
If a difference between the Running Configuration and the saved Golden Configuration is detected, a comparison between the saved Golden Configuration and the current Running Configuration is displayed. Objects removed are highlighted in red; objects added are highlighted in green. For example:
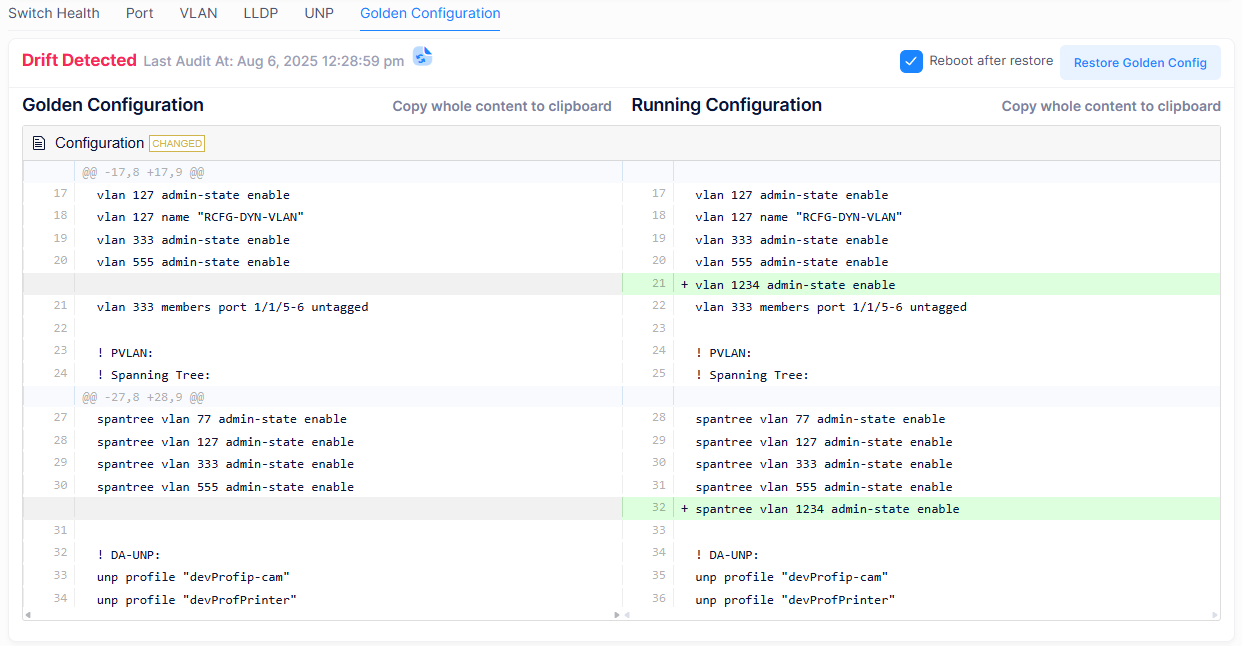
You can perform any of the following actions from the Golden Configuration tab:
-
View the differences between the saved Golden Configuration and the Running Configuration.
-
Copy the Golden and/or Running Configuration to the clipboard.
-
Determine the date and time the Drift was detected.
-
Perform an immediate audit of the switch configuration.
-
Click on Restore Golden Config to restore the Golden Configuration as the device configuration for the switch. By default, the “Reboot after restore” option is selected. Consider the following when you select this action:
-
Restore Golden Configuration with the “Reboot after restore” option selected
The Golden Configuration is copied to the switch as the new Running Configuration and reloads the switch. -
Restore Golden Configuration with the “Reboot after restore” option is not selected
The Golden Configuration is copied to the vcboot.cfg of the switch as the new configuration file and the switch is not reloaded. The current Running Configuration for the switch remains.
-
Please see Auditing the OmniSwitch Golden Configuration online help for more information.