The Client Analytics Dashboard provides an overview of Client metric values. To access the Client Analytics Dashboard, click on Analytics > Clients > Client Analytics under the “Monitor” section of the OmniVista Cirrus Menu.
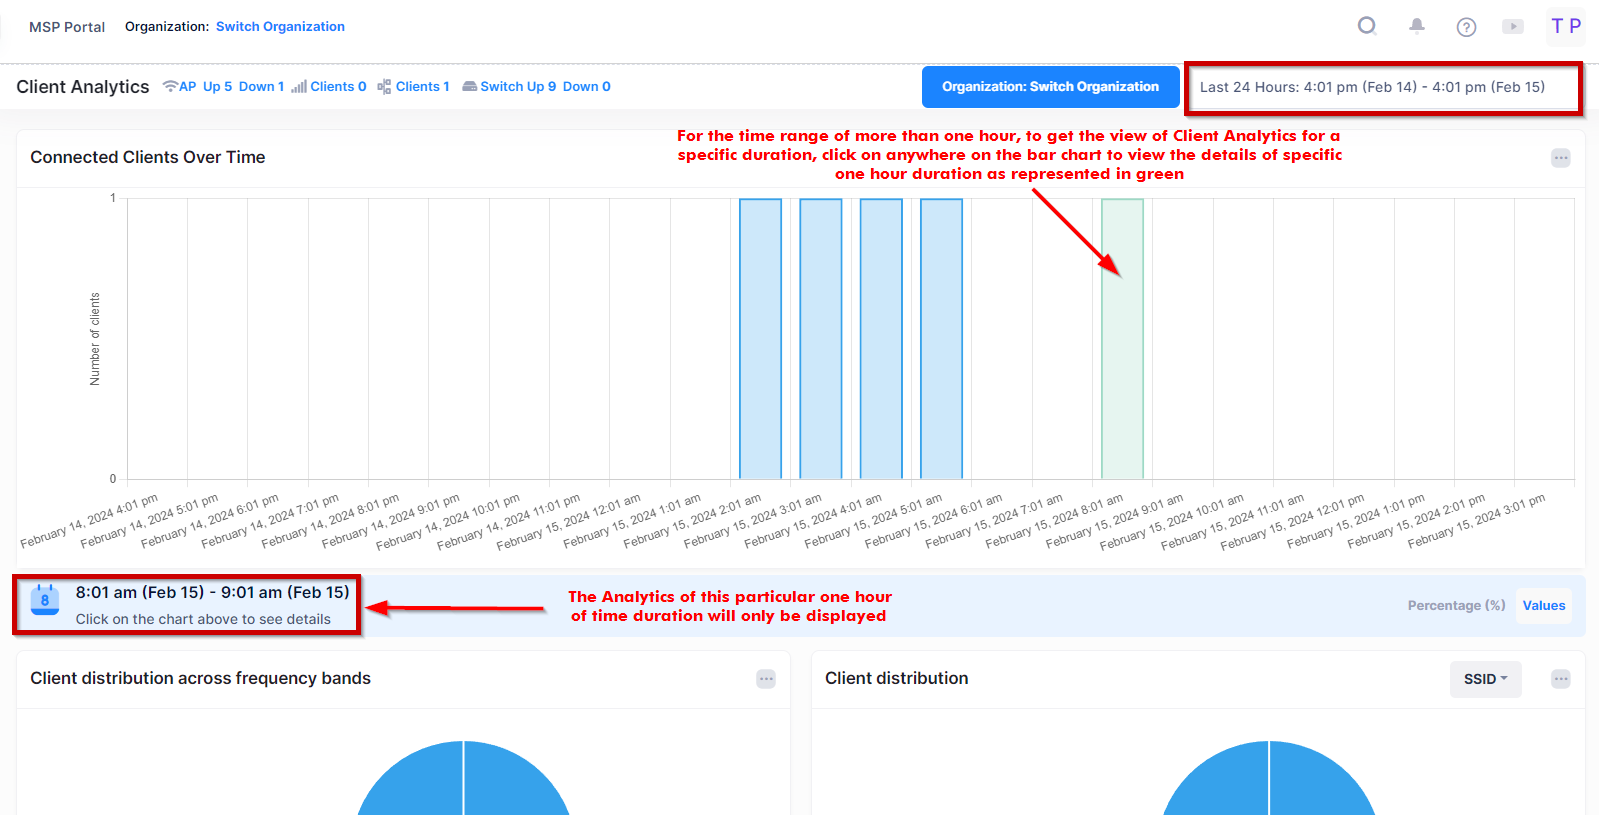
The Network Analytics Summary at the top of the dashboard displays the total number of Access Points, Access Points Up, Down Count, number of Live Wireless and Wired Clients, total number of Switches, Switches Up and Down Count in the Network.
Adjust the display filters on the dashboard by selecting either the entire Organization, specific Sites, Building, Floors, or even Access Points to display metrics related to Clients that are connected to the managed Access Points located within the selected scope. You can also select a period of time during which metrics are retrieved.
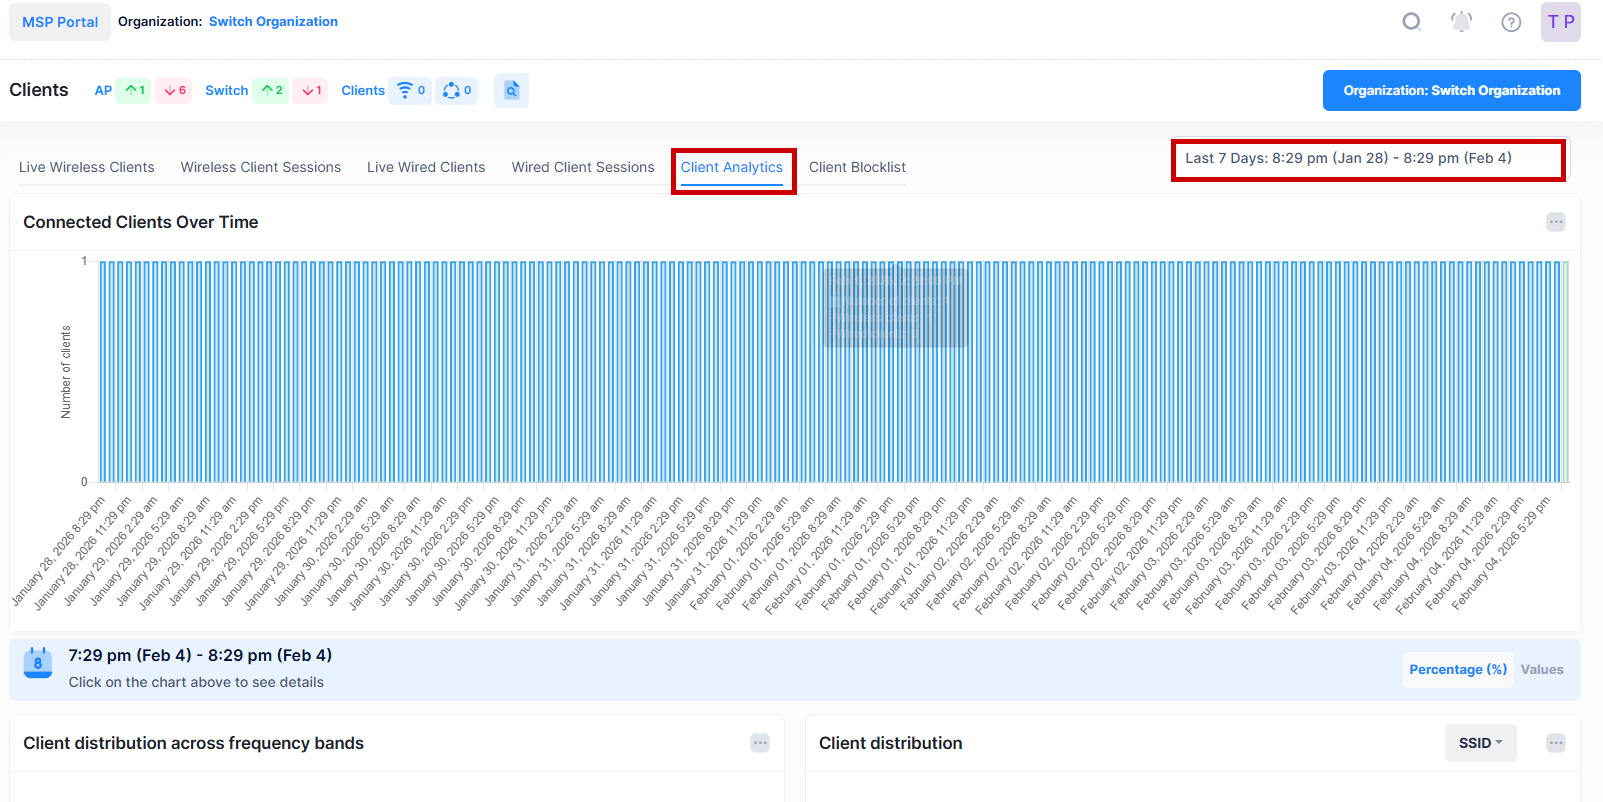
The Connected Clients Over Time bar graph display changes with different Time filter selections. If you select the last one hour time window range, then all the chart attributes are displayed by default. However, if you select a longer range of time period, such as the last 6 hours or last 7 days, to get the view of all the other related pie charts for a specific duration, click on a date time period on one of the bars in the chart, which represents a single hour (indicated in green rectangle) as shown below.
Use the Client Analytics Dashboard to monitor and evaluate the following metric values:
Note: The time range which can be selected to view the latest Client Analytics metrics should not be more than 7 days. You cannot customize the range to view client analytics metrics for the last 30 days period.