The Connected Clients Over Time section of the Client Analytics Dashboard includes widgets that shows the graphical display of the number of clients connected to managed Access Points during the specified time window. The “Select time” option is used to select the date and period by clicking on one of the bars from the chart to display the other related Client Analytics metrics on the screen. By default, the bar chart selects and displays the latest available Client details for the last hour range.
The Network Analytics Summary at the top of the dashboard displays the total number of Access Points, Access Points Up, Down Count, number of Live Wireless and Wired Clients, total number of Switches, Switches Up and Down Count in the Network.
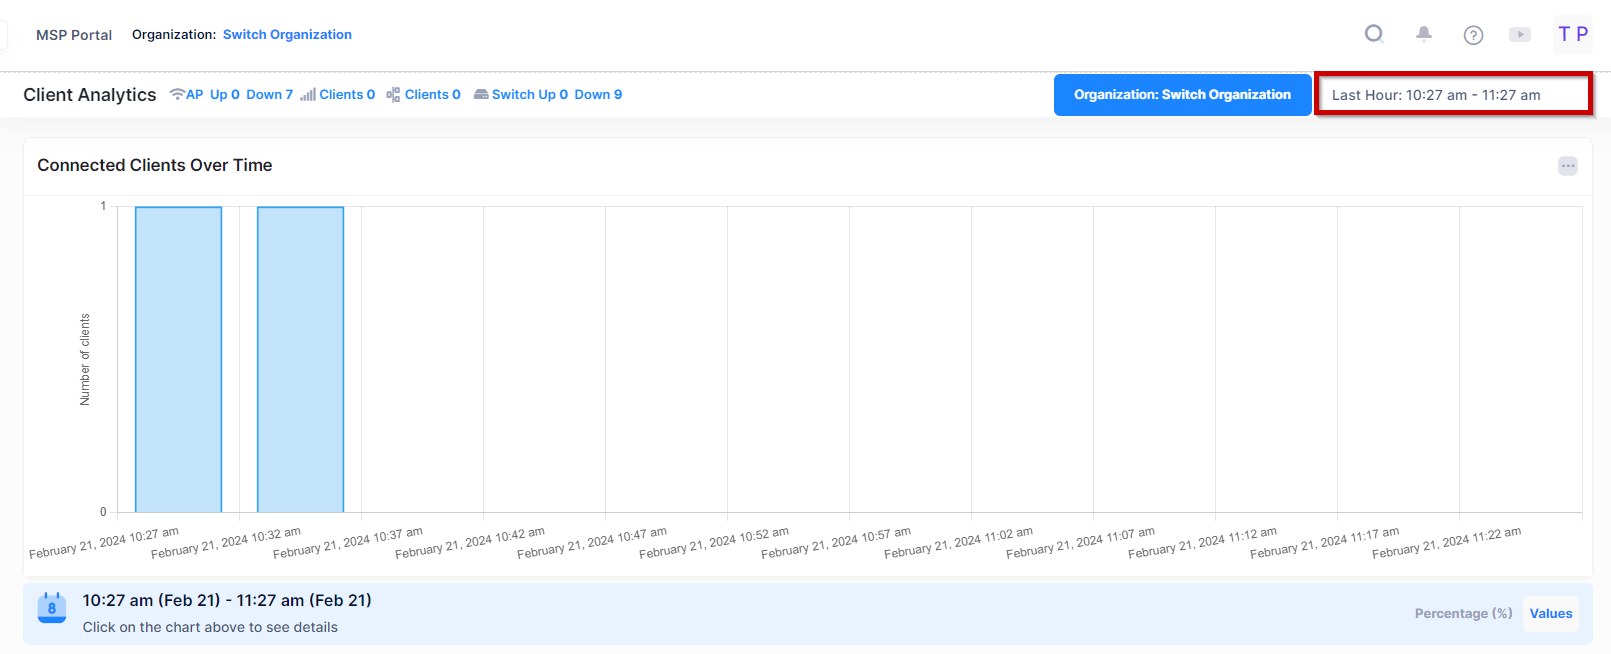
Note: The Chart bar data is not clickable for the last hour’s time duration. However, more than one hour, you can click anywhere on the bar chart to see the detail Analytics and all related Chart details for a specific time duration.
Data displayed in the chart widget can be exported into a CSV or Excel sheet format. You can also switch the widget to full-screen mode for a better display.
Note: Do not select a time range to view the latest Client Analytics metrics that is more than 7 days. You cannot specify a custom time range to view the Connected Clients Over Time metrics for the last 30-day period.