The Client Density displays information about the number of clients and system throughput on the network.
The Client Density information can be viewed for:
Current Client Density
The density information can be viewed in the form of heatmaps. The heatmap is based on density of clients. (If the density is high, it is shown red, medium density yellow, low density green, etc.)
The heatmaps are calculated using the number of devices detected at any time. The colors represent the areas on the map where there is the most "presence." The intensity is based on how many devices were detected during the time period. Areas may be dark red because there were lots of devices detected.
The Current Client Density can be accessed by clicking Client Density > Current Client Density under the “Monitor” section of the OmniVista Cirrus Menu.
The Current Client Density screen is displayed.
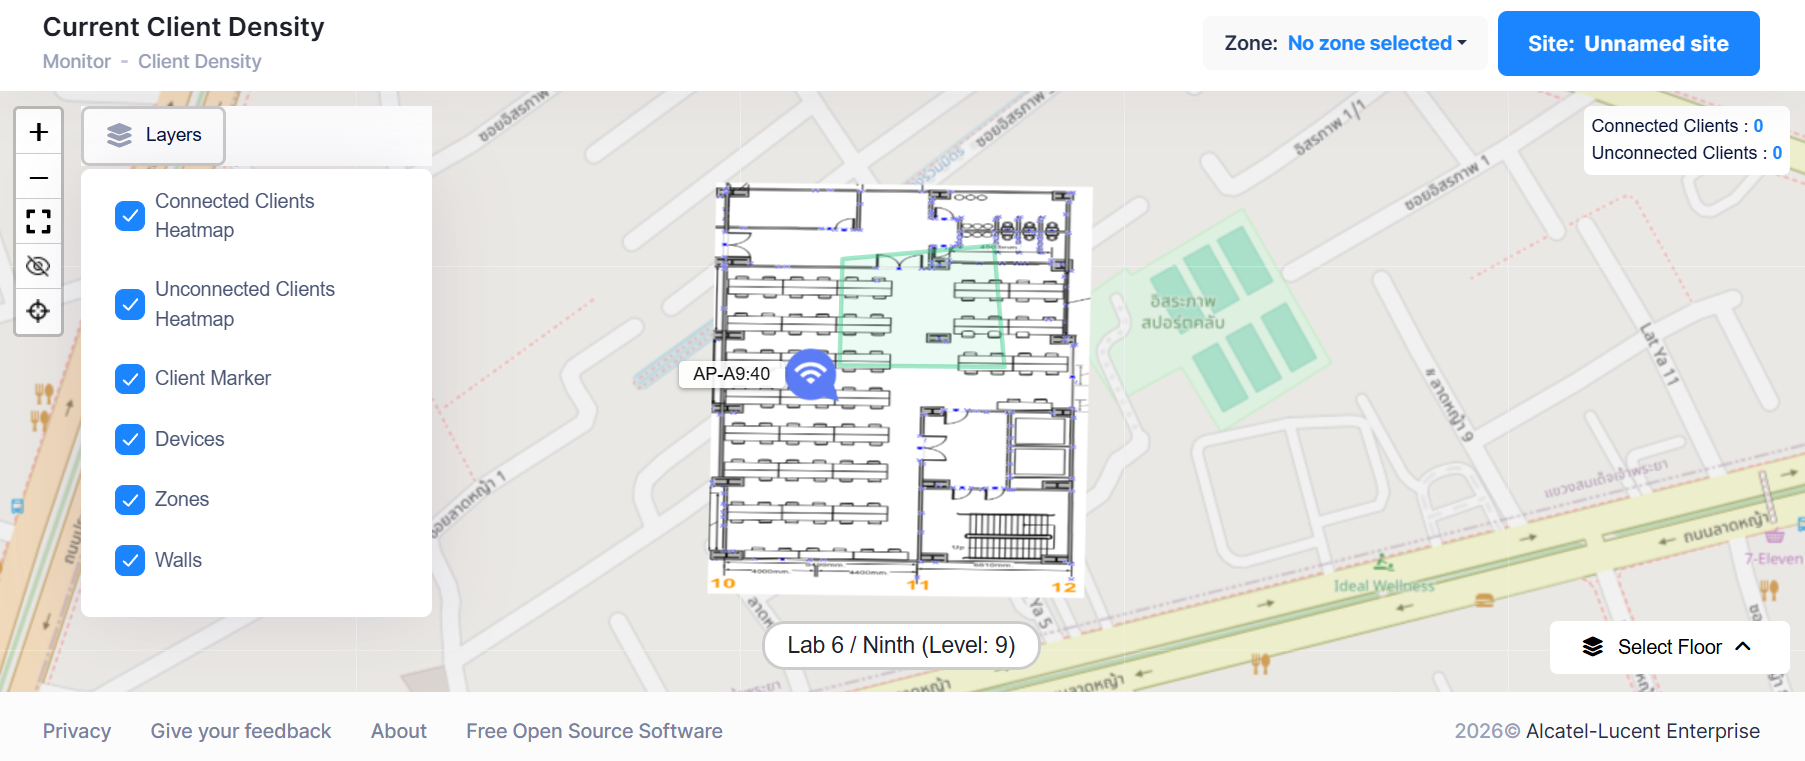
You can filter the view of the Current Clients Heatmaps by selecting or unselecting the following layers:
-
Connected Clients Heatmaps
-
Unconnected Clients Heatmap
-
Client Marker
-
Devices
-
Zones
-
Walls
The view can be customized by selecting different Zone and Sites.
You can filter the view further by selecting floors with the Select Floor option.
Client Density History
On the Client Density History screen, Total Dwell time can be calculated for each client that has connected to at least 1 AP presented in the zone, within the selected time period. When you click on a particular zone, the trend view of the client density in this zone will be displayed (using the time range selected).
The Client Density History can be accessed by clicking Client Density > Client Density History under the “Monitor” section of the OmniVista Cirrus Menu.
The Current Client Density screen is displayed.
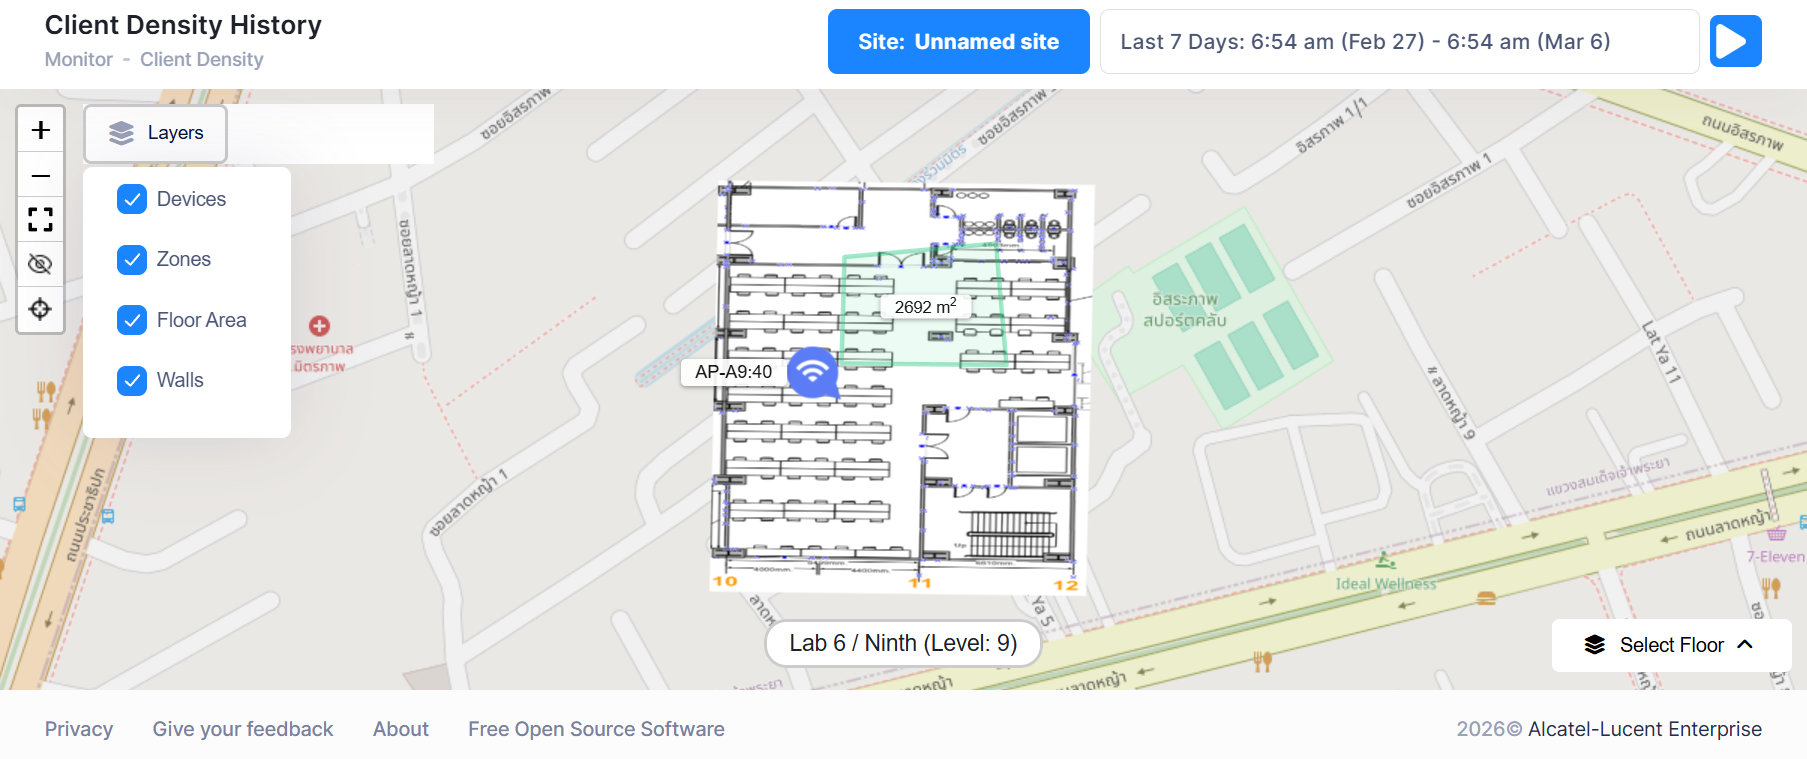
You can filter the view of the Current Density History by selecting or unselecting the following layers:
-
Devices
-
Zones
-
Floor Area
-
Walls
For more information on monitoring network components and device activity, see Monitoring Network Device Activity.