The Locator feature in OmniVista provides a centralized and intuitive way for network administrators to find, identify, and track network clients and user devices (such as laptops, phones, IoT endpoints) based on their activity and presence in the network.
The primary purpose of Locator is to provide an operational overview of connected clients (end-user devices) and their network sessions. Locator is not intended for locating or managing infrastructure devices (such as APs and switches).
To access the Locator feature, click on Locator under the “Monitor” section of the OmniVista Cirrus Menu.
The Locator page is displayed as follows:
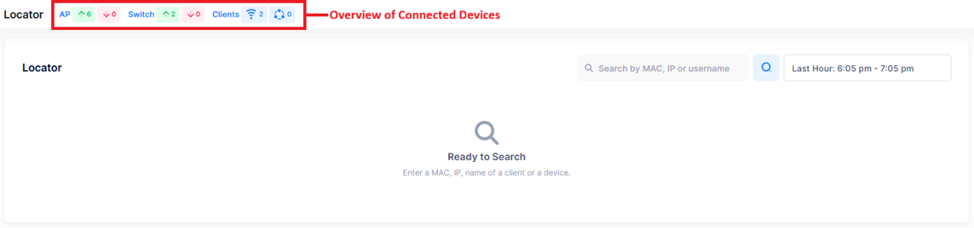
In the Locator page, you can quickly view the overview of the type of clients connected (APs and Switches), the number of clients up, the number of clients down, the number of live wireless clients, and the number of live wired clients.
You can also search information using the Locator Search Bar.

The search bar allows you to locate client records using:
-
MAC address
-
IP address (IPv4 or IPv6)
-
Username (Client or Device)
The time filter allows you to:
-
Search for currently connected entities.
-
Review recent or historical activity.
-
Searching by AP or switch serial number, or expecting Locator to directly find managed infrastructure devices, is not supported.
-
Infrastructure devices can appear in Locator results only if they are acting as clients (for example, an AP as a UNP client on a switch).
-
Non-UNP clients connected to AOS 8x switches appear only when the IoT feature is enabled on the switches. To check if it is enabled, look at the IoT Status column in the Device Catalog. If the status is Disabled, select the switches and enable the feature from the Actions menu. Enforcement action, however, is supported only for UNP ports. To view connected clients immediately, disconnect and reconnect the client.
Locator Search Mechanism
-
Locator searches records of network clients and their sessions.
-
Results depend on the data stored about client activity. For example:
-
Searching by a MAC or IP will show client records where those values are present.
-
If an AP or switch appears, it is because it is acting as a client in some network context.
-
-
Results can differ depending on the attribute searched (MAC, IP, username), due to differences in how data is stored and correlated.
Performing a Device or Client Search
To perform the search, enter a “MAC, IP, name of a client or a device” in the search box and click on the search icon located next to it.
The search information is displayed.
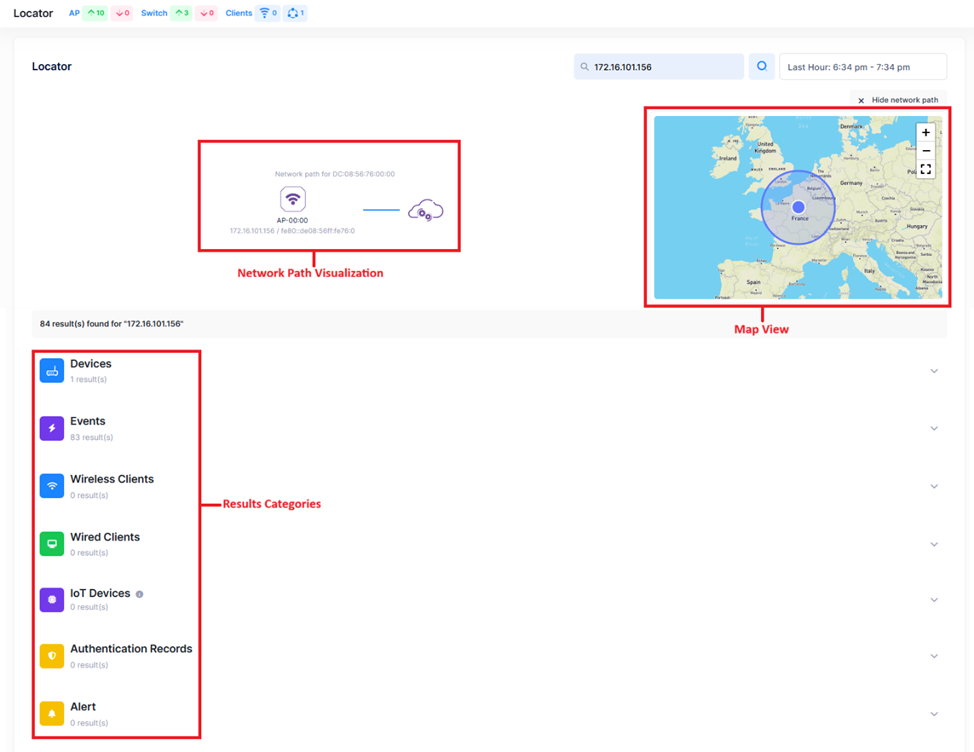
Once a search is performed, results are grouped into collapsible categories, showing the number of matches found for each category. You can view the results for a specific time by selecting the time in “Time Filter” box.
Result Categories Displayed
-
Devices - Displays the list of the identified client devices (not infrastructure devices) and the general information associated to it.
-
Events - Displays the list of network events related to the searched MAC, IP, or username.
-
Wireless Clients - Displays the list of devices connected via Wi-Fi.
-
Wired Clients - Displays the list of wired endpoints connected.
Only edge ports are reported, ensuring the client is shown at the actual access switch and port, not on inter-switch links. -
IoT Devices - Displays the list of IoT endpoints discovered through device profiling.
This information is displayed only if the IoT is enabled on the device.
-
Starting with AOS 8.10R04, switches report both UNP and non-UNP clients on IoT enabled switches. To check if it is enabled, look at the IoT Status column in the Device Catalog. If the status is Disabled, select the switches and enable the feature from the Actions menu. Enforcement action, however, is supported only for UNP ports. To view connected clients immediately, disconnect and reconnect the client.
-
Authentication Records - Displays authentication-related information such as:
-
Username
-
Authentication method (for example, 802.1X or captive portal)
-
Authentication result
-
Associated switch, port, or AP
-
Both live and historical authentication records may be shown depending on the selected time range.
-
Alerts - Shows any alerts associated with the searched entity, allowing users to:
-
Quickly identify security or connectivity issues.
-
Correlate alerts with client presence or movement.
-
-
Network Path Visualization - The Locator displays a network path view at the top of the results:
-
Visual representation of how the client is connected
-
Shows the relationship between client, access device, and upstream network
This provides immediate contextual awareness without switching to another view.
-
The Network Path Visualization and Map View show the connection path and location from the perspective of the located client record. If an infrastructure device appears in this path, it is only in the context of client connectivity.
-
Map View (Geographical Context) - The Map View:
-
Displays the geographical location of the site or device.
-
Helps visualize where the client is connected geographically.
-