The Application Visibility Application identifies application/protocol flows based on Application Signatures that identify an associated application or protocol. To enable Application Visibility, you create a Signature Profile that includes all of the signatures for applications/protocols that you want to monitor/control, and apply that profile to Access Points and Switch Devices.
To access the Application Visibility Dashboard, click on Analytics > Application Visibility under the “Monitor” section of the OmniVista Cirrus Menu.
The Application Visibility Analytics dashboard provides the following analytics data:
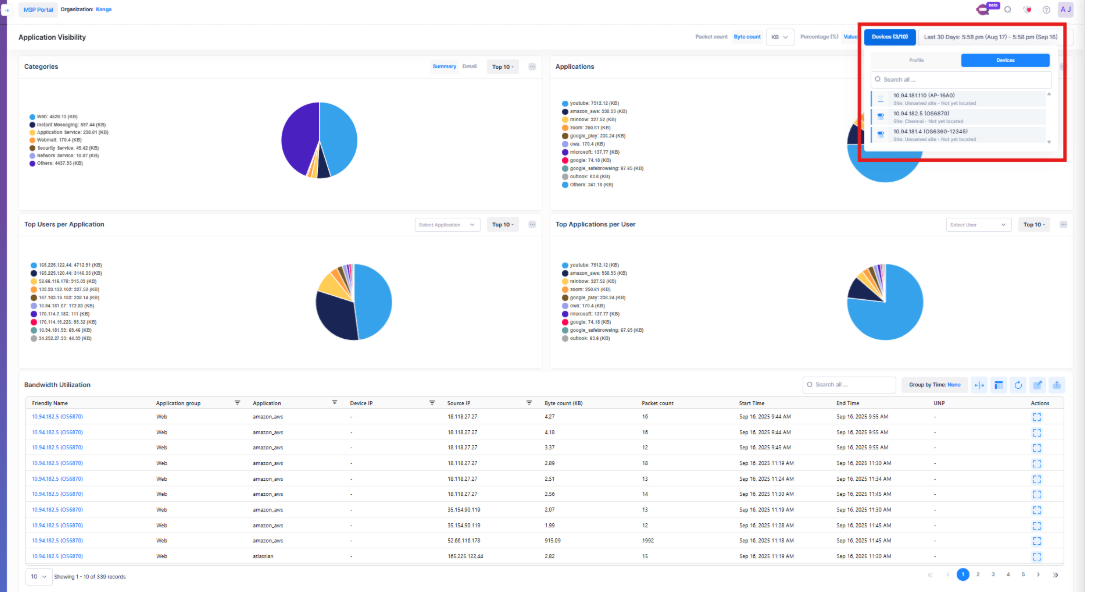
You can select both Access Points and Switch devices simultaneously under the Select Entity button to view Application Visibility data analytics for both device types, as shown below:
Category Bandwidth Usage
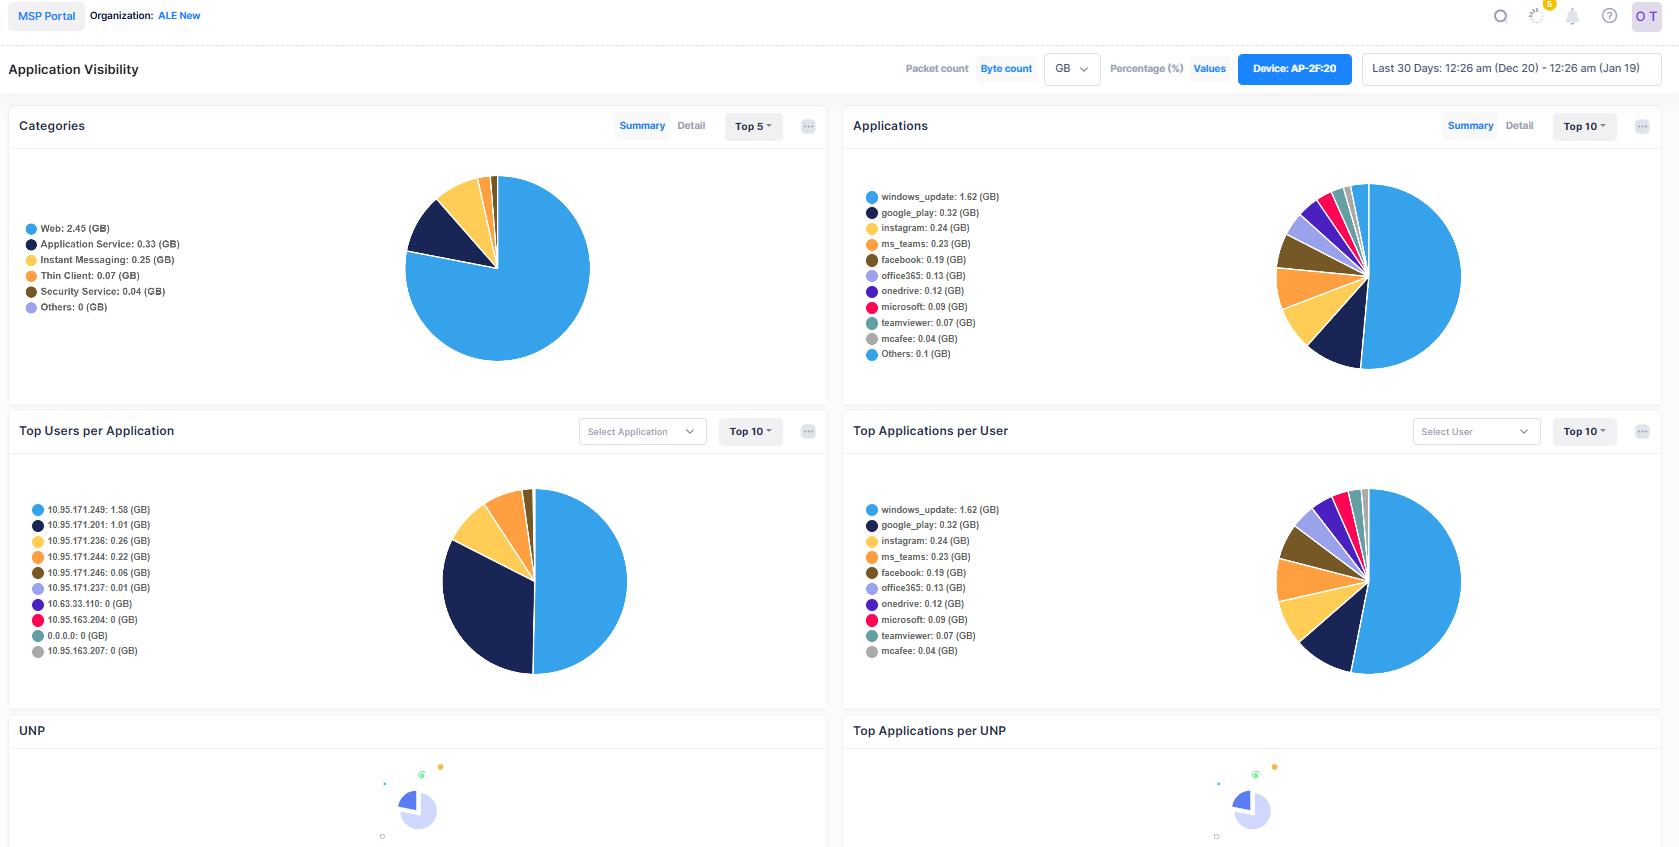
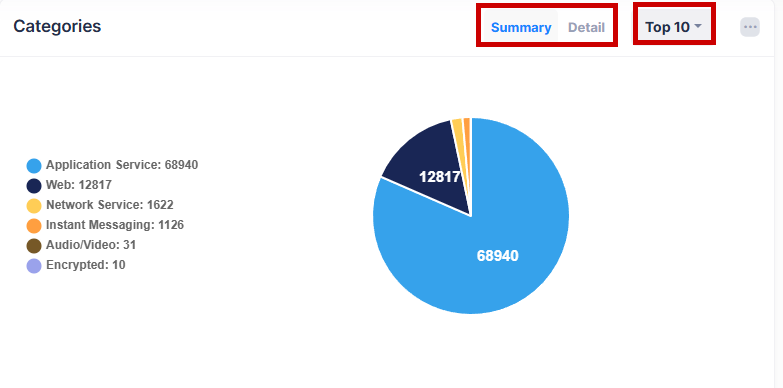
The Category Bandwidth Usage screen displays traffic flow information for Application groups discovered on the network, and the number of network resources being used by each application for the selected devices and configured time period. By default, the Summary view is displayed but you can toggle to the Detail view by clicking on the respective tab. By default, Top 10 Categories bandwidth usage are displayed.
Data displayed in the chart widget can be exported into a CSV or Excel sheet format. You can also switch the widget to full-screen mode for a better display.
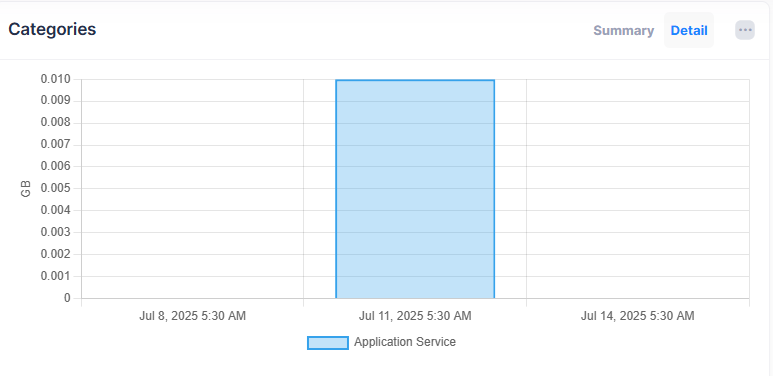
By clicking on a specific Category in the Pie chart, you can view the Detail traffic flow for the Category as shown below:
Application Bandwidth Usage
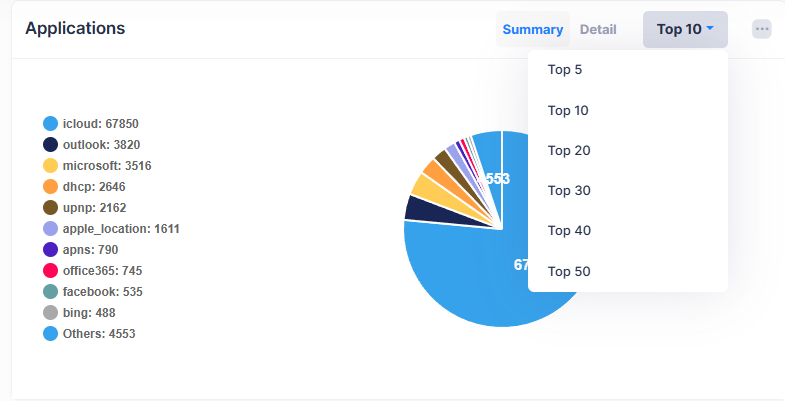
The Application Bandwidth usage screen displays packet or byte count information for Applications discovered on the network over the configured period of time, and the percentage of network resources being used by each application for the selected devices and configured time period. You can also view the detail bar chart of the Application information or Top N Applications usage by clicking on the respective tab. By default, Top 10 Applications bandwidth usage are displayed.
Data displayed in the chart widget can be exported into a CSV or Excel sheet format. You can also switch the widget to full-screen mode for a better display.
Top Users per Application
The Top Users per Application screen displays the top users (IP address) for the selected application. You can also select an application from the Select Application drop-down menu to display the top users for the selected Application. You can also view the Top N Users for each Application from this tab.
By default, the summary view is displayed on the screen but by clicking anywhere on the pie chart, you can access a detailed view of the data presented in a bar chart format for the specified time period. And you can also select or deselect an application(s) in the legend to add/remove the application(s) from the display. Click on the back arrow, to go to summary view.
Data displayed in the chart widget can be exported into a CSV or Excel sheet format. You can also switch the widget to full-screen mode for a better display.

Top Applications per User
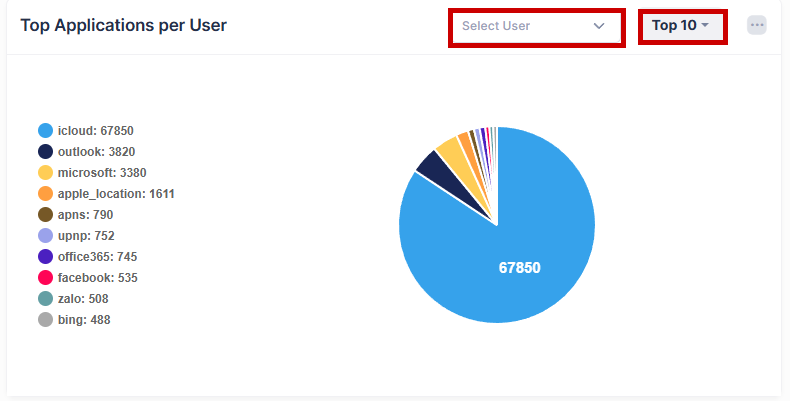
The Top Applications per User screen displays the top Applications for the selected user (IP address). Select a User (IP address) from the Select User drop-down menu to display the top Application for the selected user.
You can also view the Top N Applications per user from this tab. By default, the summary view is displayed on the screen but by clicking anywhere on the pie chart, you can access a detailed view of the data presented in a bar chart format for the specified time period. And you can also select or deselect an user(s) in the legend to add/remove the user(s) from the display. Click on the back arrow, to go to summary view.
Data displayed in the chart widget can be exported into a CSV or Excel sheet format. You can also switch the widget to full-screen mode for a better display.
UNP Usage
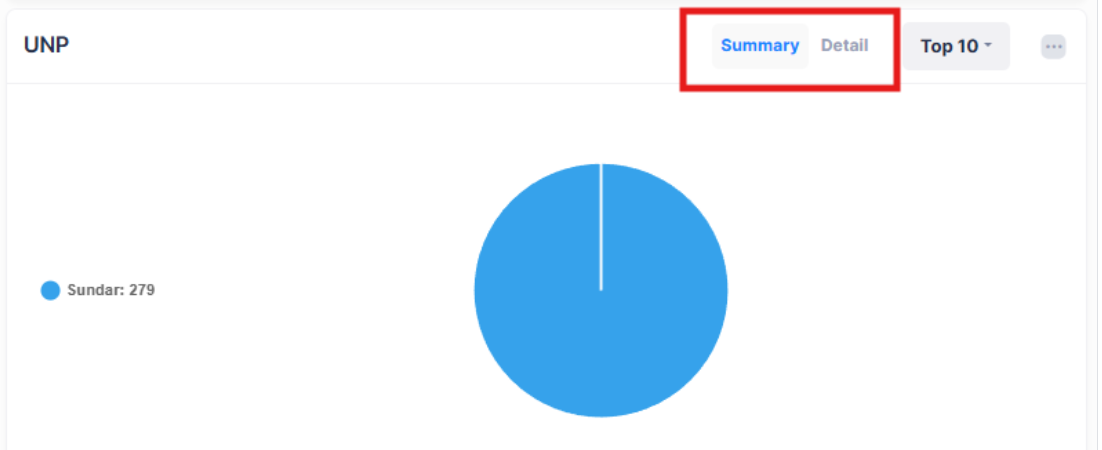
The UNP Usage screen displays application information by UNP Profile used by each application for the selected devices and configured time period. By default, the Summary view is displayed but you can toggle to the Detail view by clicking on the respective tab. By default, Top 10 UNPs usage are displayed.
Data displayed in the chart widget can be exported into a CSV or Excel sheet format. You can also switch the widget to full-screen mode for a better display.
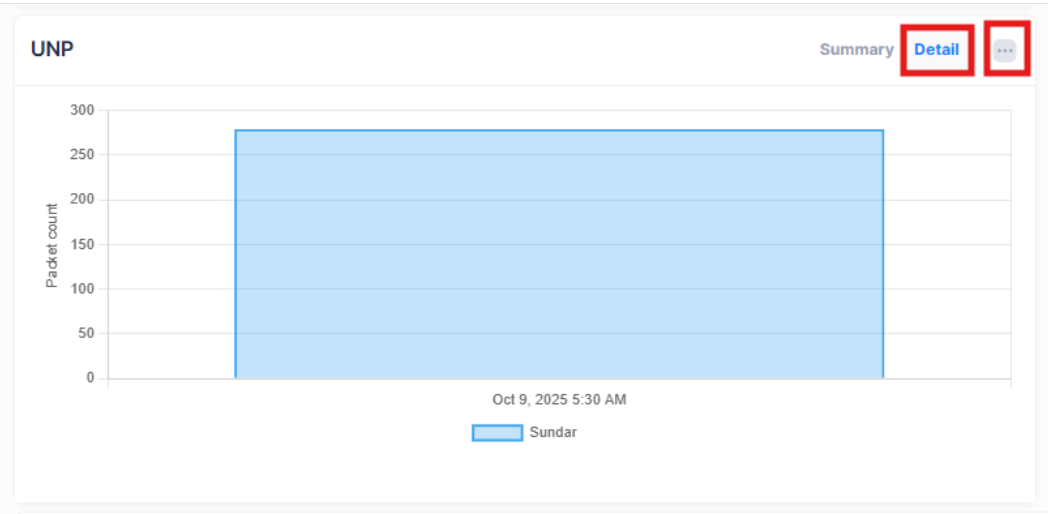
You can view the UNP data in detail view as shown below:
Top Applications per UNP
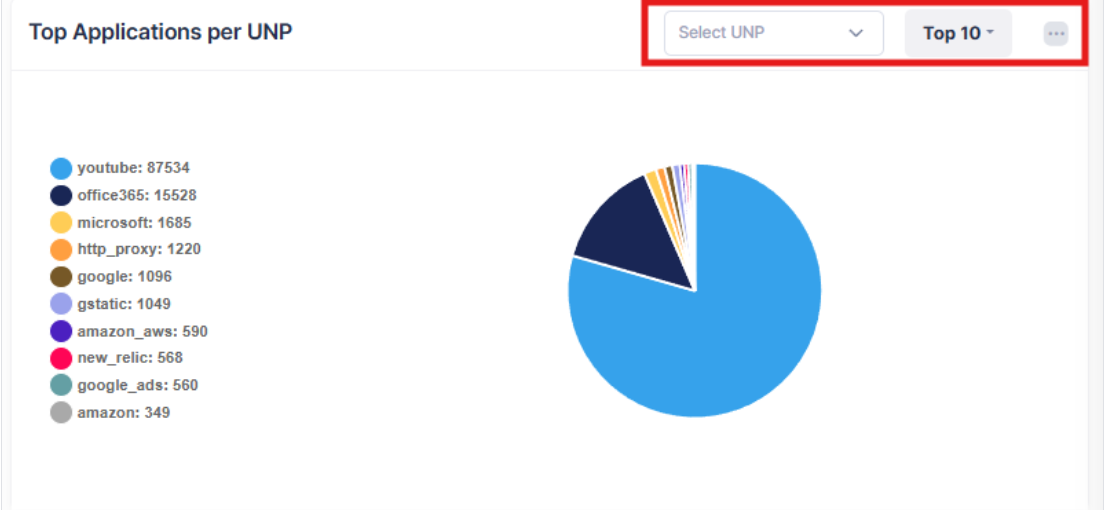
The Top Applications per UNP screen displays the top Applications for the selected UNP profile. Select a UNP from the Select UNP drop-down menu to display the top Applications as per the selected UNP.
You can also view the Top 10 Applications per UNP from this tab. By default, the summary view is displayed on the screen.
Data displayed in the chart widget can be exported into a CSV or Excel sheet format. You can also switch the widget to full-screen mode for a better display.
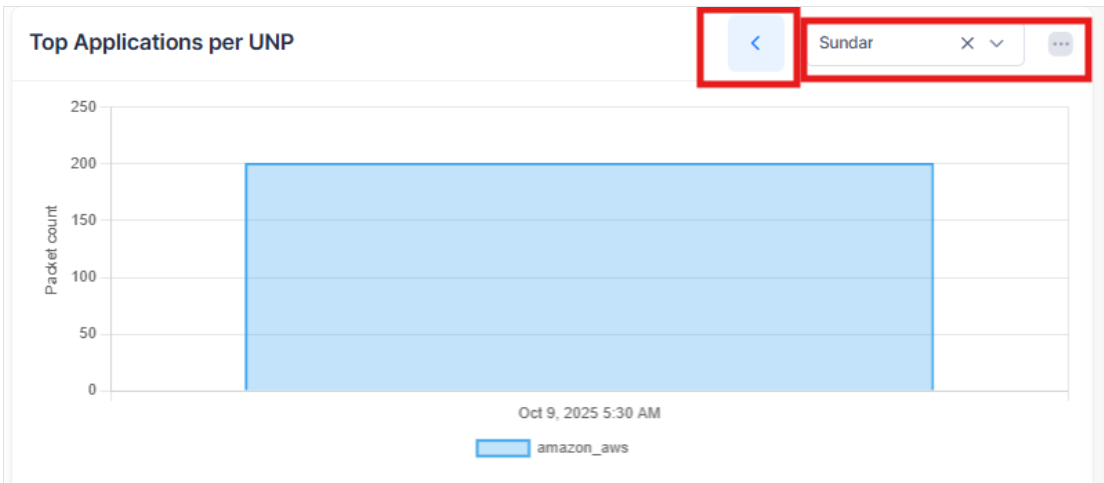
Click anywhere on the pie chart to view detailed data in a bar chart for the selected period. You can select or deselect UNP(s) in the legend to add or remove applications from the display. Click the back arrow to return to the summary view.
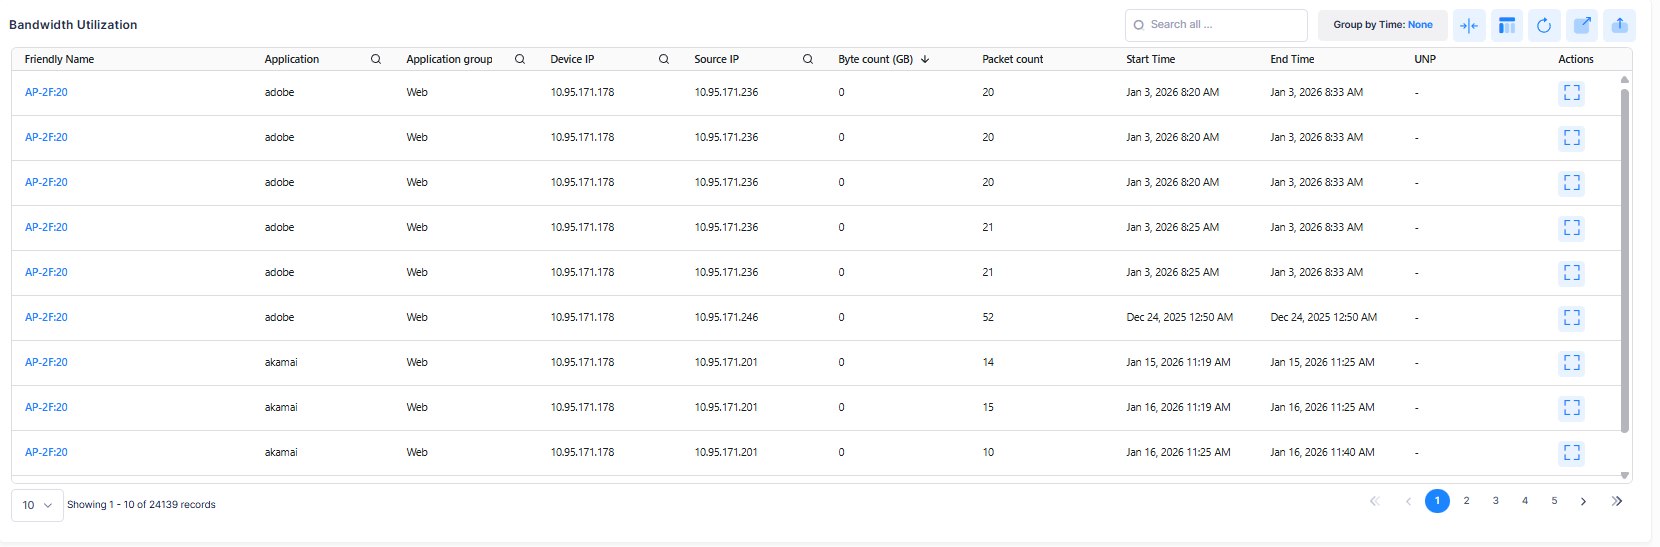
Tabular view of Bandwidth Utilization
The Bandwidth Utilization table displays the flow data with both the Access Point and Switch devices to which the source (client) generating the flows was connected.
Data displayed can be exported into a CSV, PDF or Excel sheet format. You can also switch to full-screen mode for a better display.
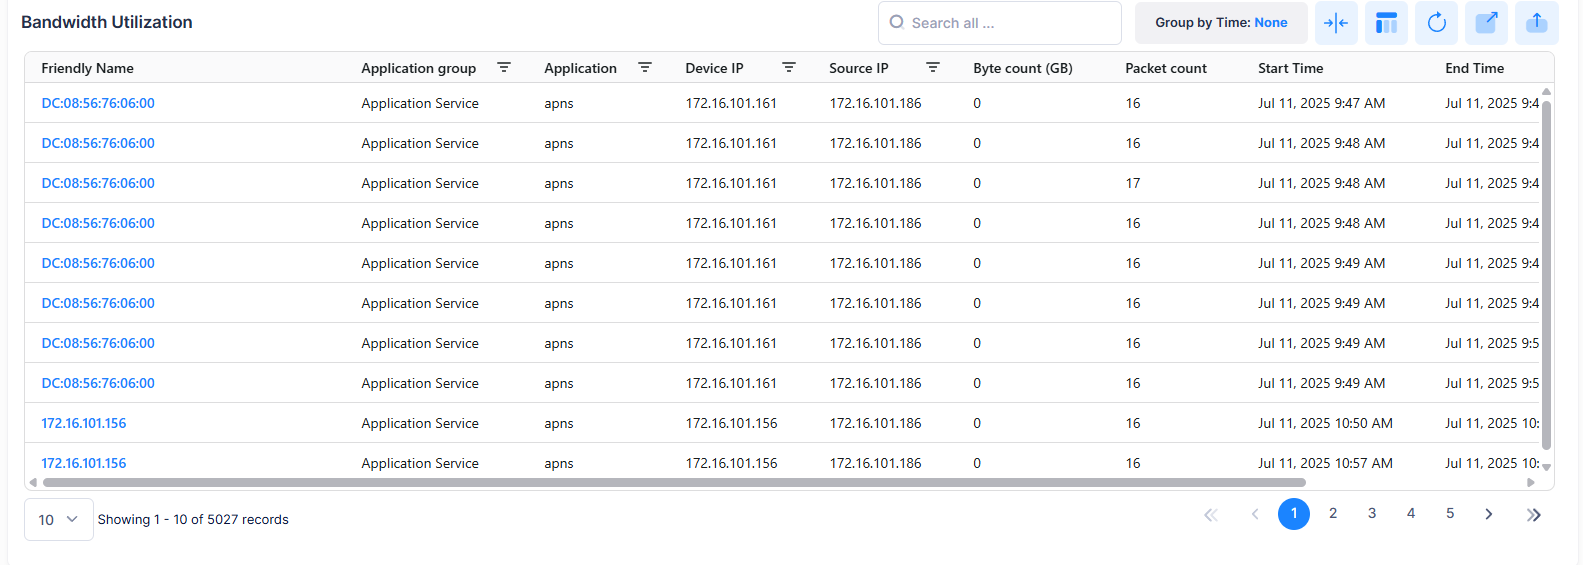
The Bandwidth Utilization table provides the following information for each of the device:
-
Friendly Name - The name assigned to the device is derived from the Preferred Device Naming convention specified in the user preference settings. By default, the Friendly Name is set to IP Address (System Name).
-
Application group - Displays flow information for all Application groups included in the Signature Profile(s) of the selected devices.
-
Application - Displays flow information for all Applications included in the Signature Profile(s) of the selected devices.
-
Device IP - The IP address of the device.
-
Source IP - The source IP address.
-
Byte count(MB) - Displays the data unit for the byte count. By default is MB.
-
Packet count - The count of the packet flow for specified time period.
-
Start Time - The start date and time of the flow data.
-
End Time - The end date and time of the flow data.
-
UNP - The UNP profile associated with the device.
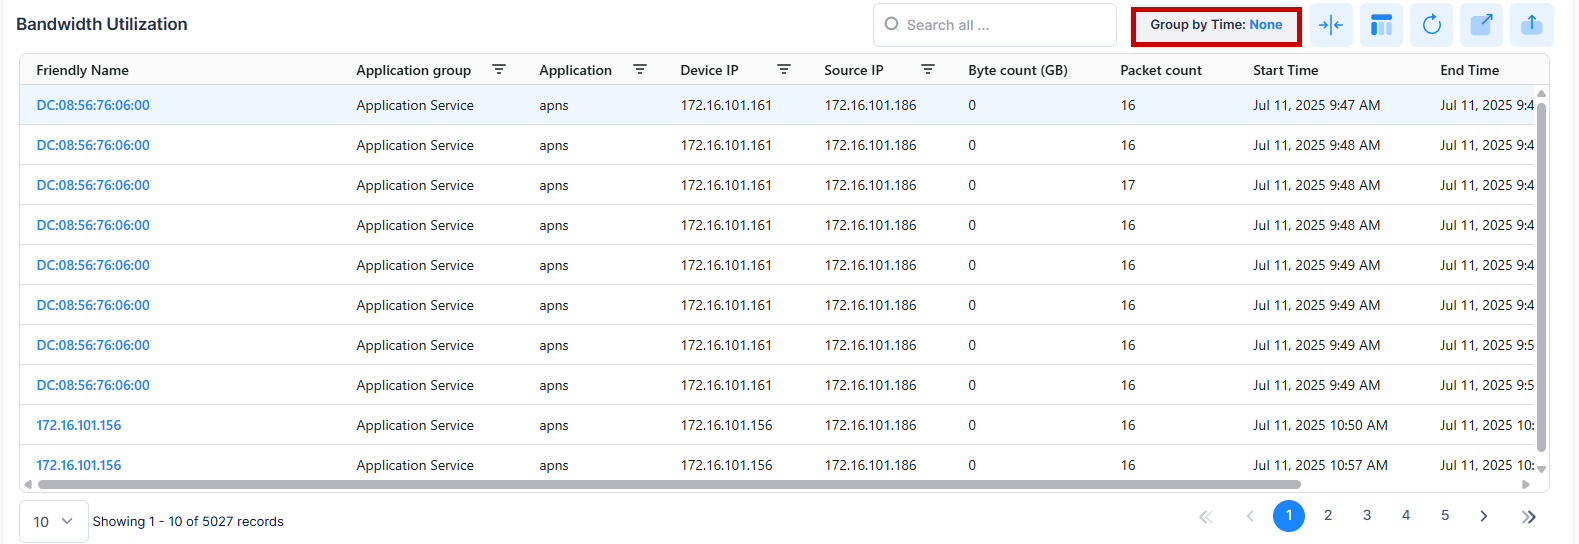
Group by Time
The Group by Time display option allows you to select a range of time to display flow data for each hour of each day for each application. To select the time range for the Group by Time, click on Group by Time and select from 5 minutes up to 24 hours from the drop-down menu. By default, the “None” option is selected, which displays the detail view of the flow data of all the applications for whole day without any grouping of time range.
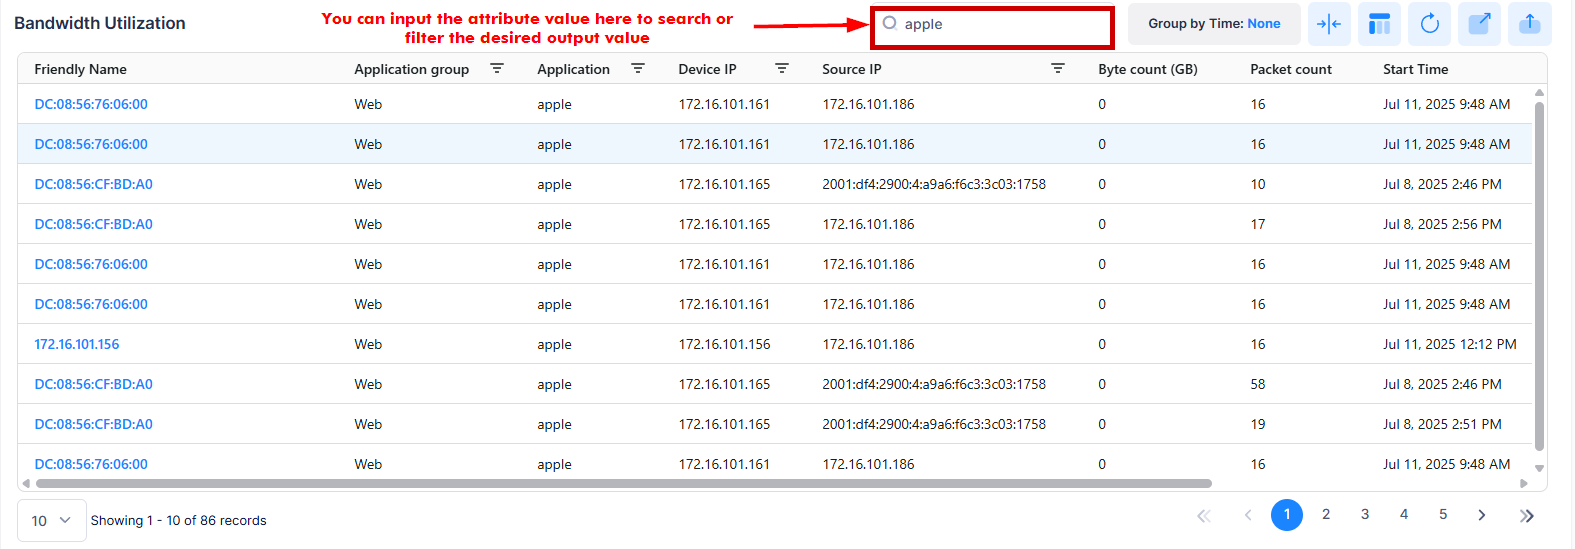
Search by an Attribute value
You can search for the specific Applications or Applications Groups by using the Search box option. The search results are refined based on the attribute value selected from the available list (Application/Application group/Device IP/Source IP). Only those output that contain the matching searched values are displayed in the results as shown below.
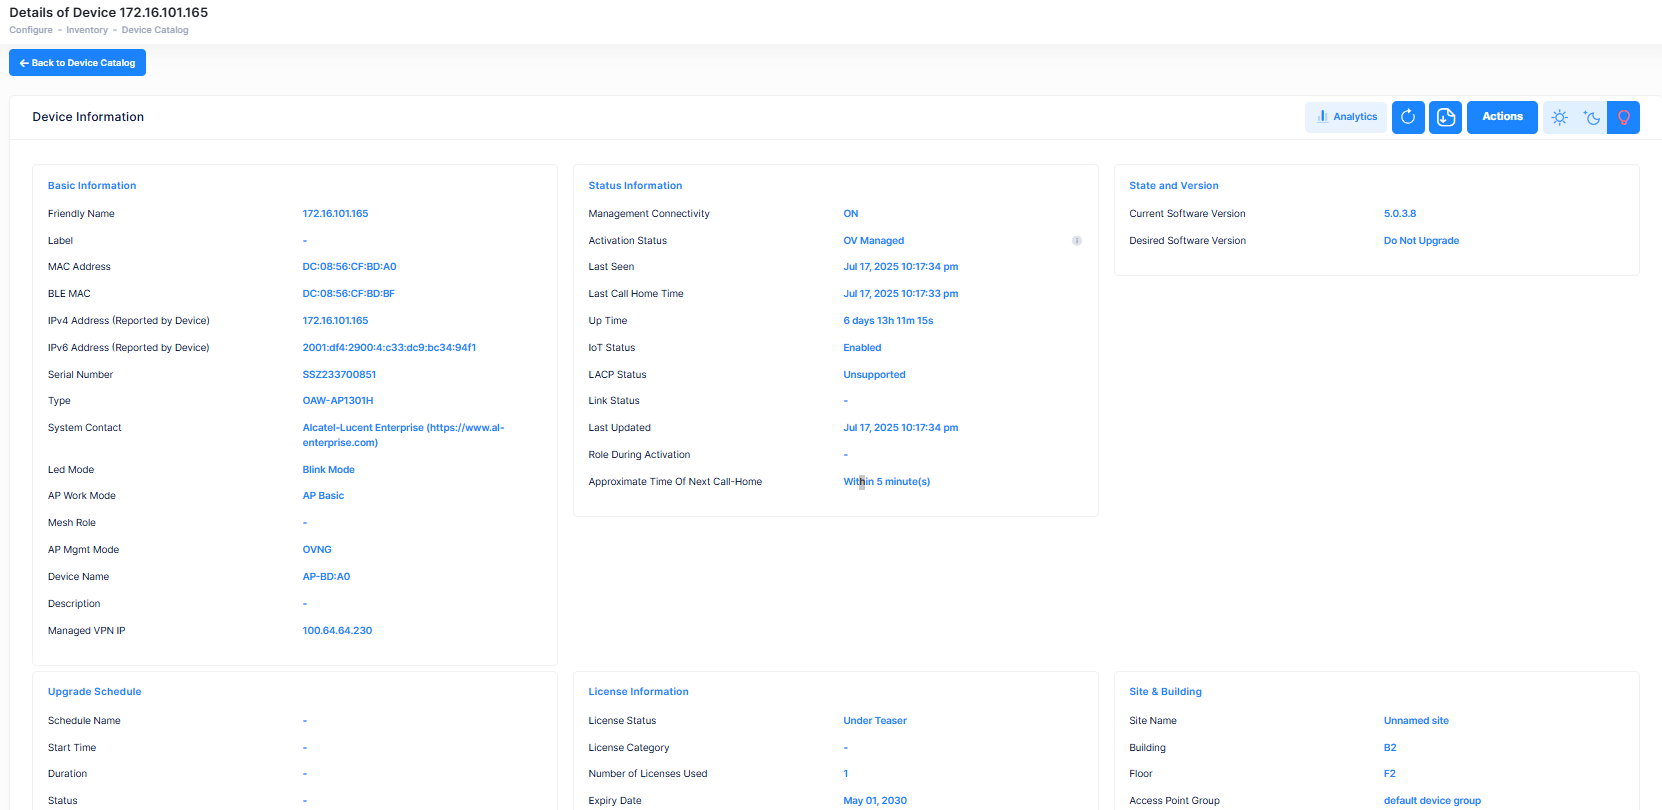
View Device Detail Information
The Bandwidth Utilization table displays information for the flow data for the configured devices. To display detailed device information about a specific device, click on the Friendly Name as shown below.
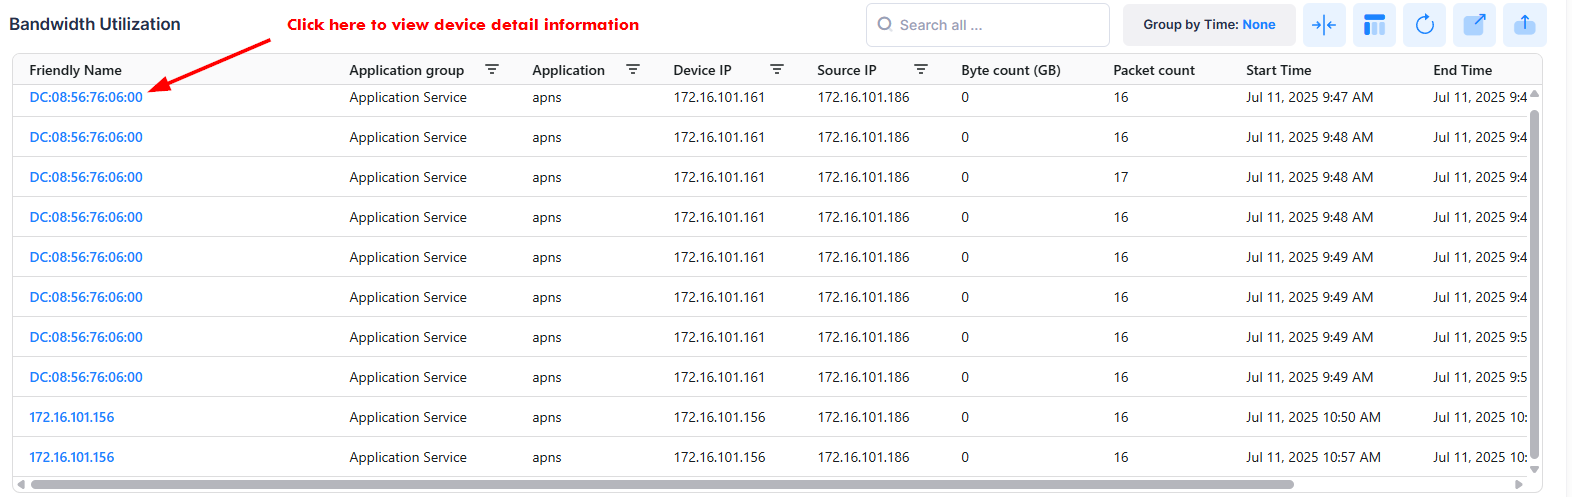
The following screen appears: