
The Anomaly History screen displays a history of Advisor Edge detected anomalies that you can analyze to detect patterns of network behavior (for example, how many anomalies were reported from a specific device). The screen automatically refreshes to display new anomaly notifications as they are received.
To view detected anomalies, click on Anomalies under the “Monitor” section of the OmniVista Cirrus Menu.
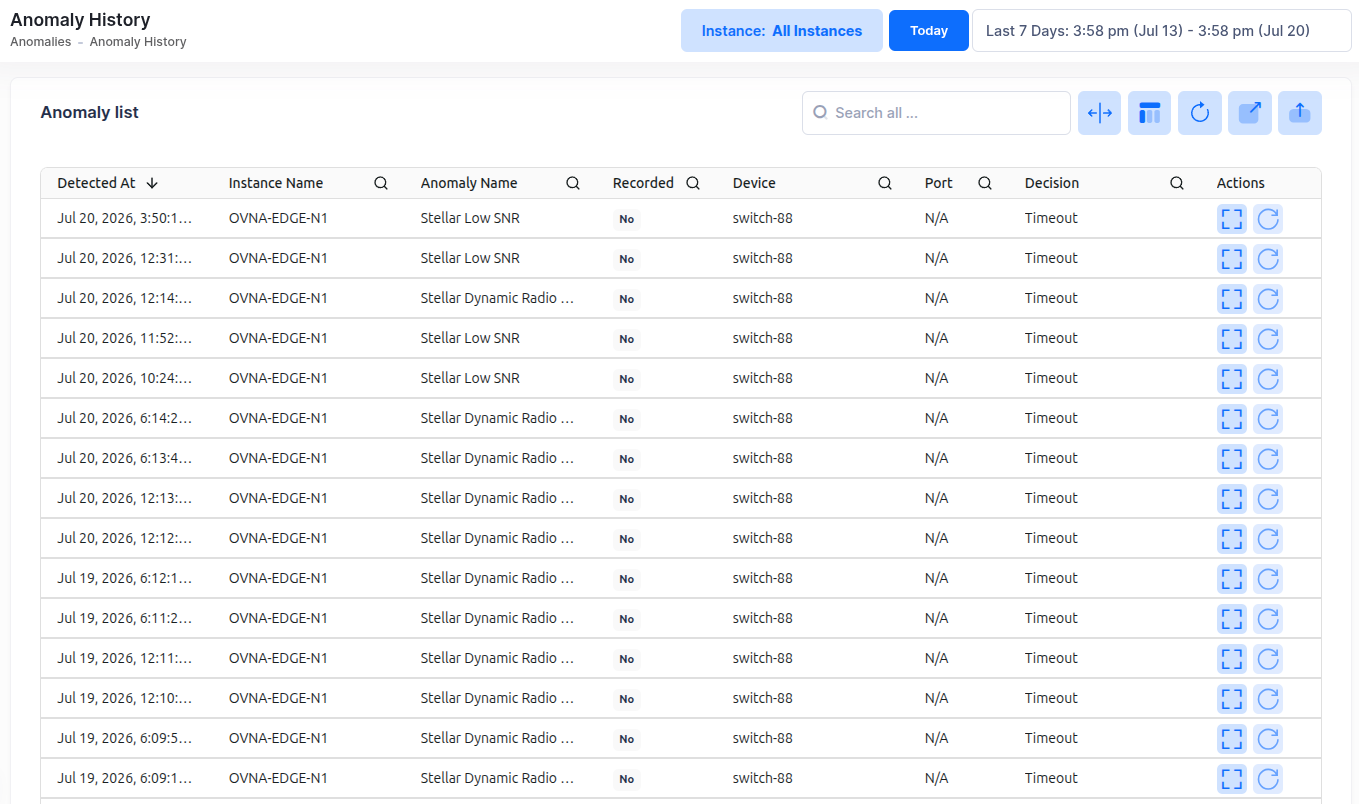
Use the filters at the top of the screen to customize the display of detected anomalies:
-
Click on Instance to filter results for a specific Advisor Edge instance.
-
Use the date range filter to view anomalies detected within a specific time period
-
Use the search bar to search for a specific anomaly type
The Anomaly History screen provides the following information for each anomaly in the list:
-
Detected At - The date and time the anomaly was detected.
-
Instance Name - The name of the OmniVista Advisor Edge instance.
-
Anomaly Name - The name of the anomaly.
-
Recorded - Whether a recommended action was taken: Yes, No, Auto-remediation set to remember, or Monitor (if monitor mode is set).
-
Device - The hostname of the device from which the anomaly was detected.
-
Port - The device port on which the anomaly was detected.
-
Decision - The decision made via a Rainbow alert to remedy the anomaly, or indicates a timeout or failed decision.
-
Decision By - The Rainbow username of the user who acted on the anomaly.
-
Decision At - The date and time the remediation decision was made.
-
Rollback By - The Rainbow username of the user who cleared the remediation action
-
Rollback At - The date and time the remediation action was cleared
-
Description - Additional information about the detected anomaly