OmniVista Cirrus can generate alerts based on the network device events and user configuration failure. Similar to the Events notification screen, the Alerts screen provides a list of alerts received and basic alert information (for example, severity, date/time received). You can also manage alerts and configure alert templates to identify specific alerts that you want OmniVista Cirrus to report.
There are two ways to access the Alerts screen from the Organization Dashboard:
-
Click on the Alerts panel heading in the lower-right of the dashboard.
-
Click on the Diagnostic Tools > Alerts option under the “Monitor” section of the OmniVista Cirrus menu.
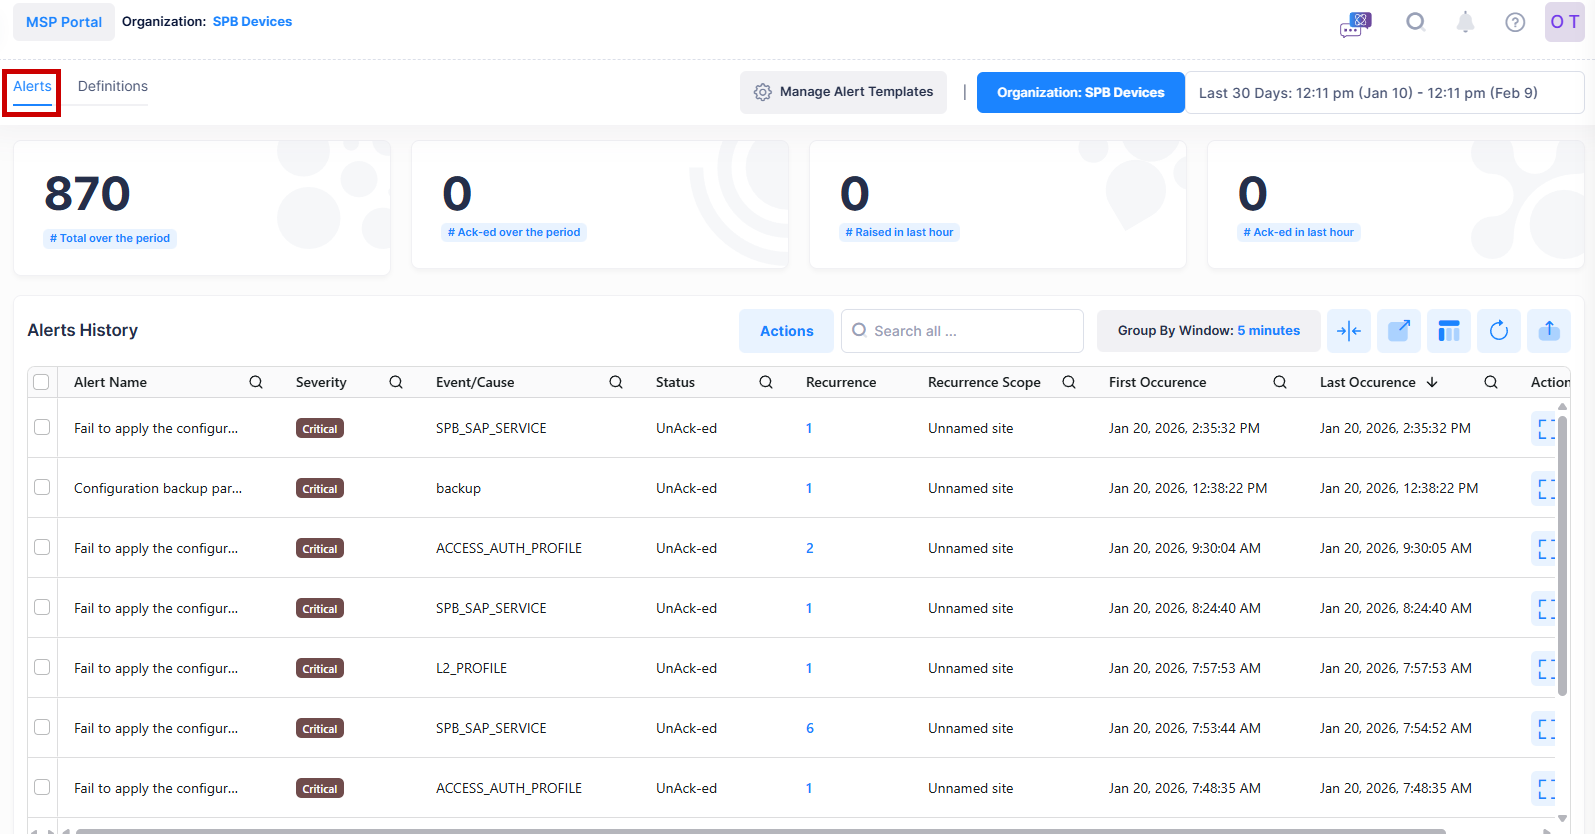
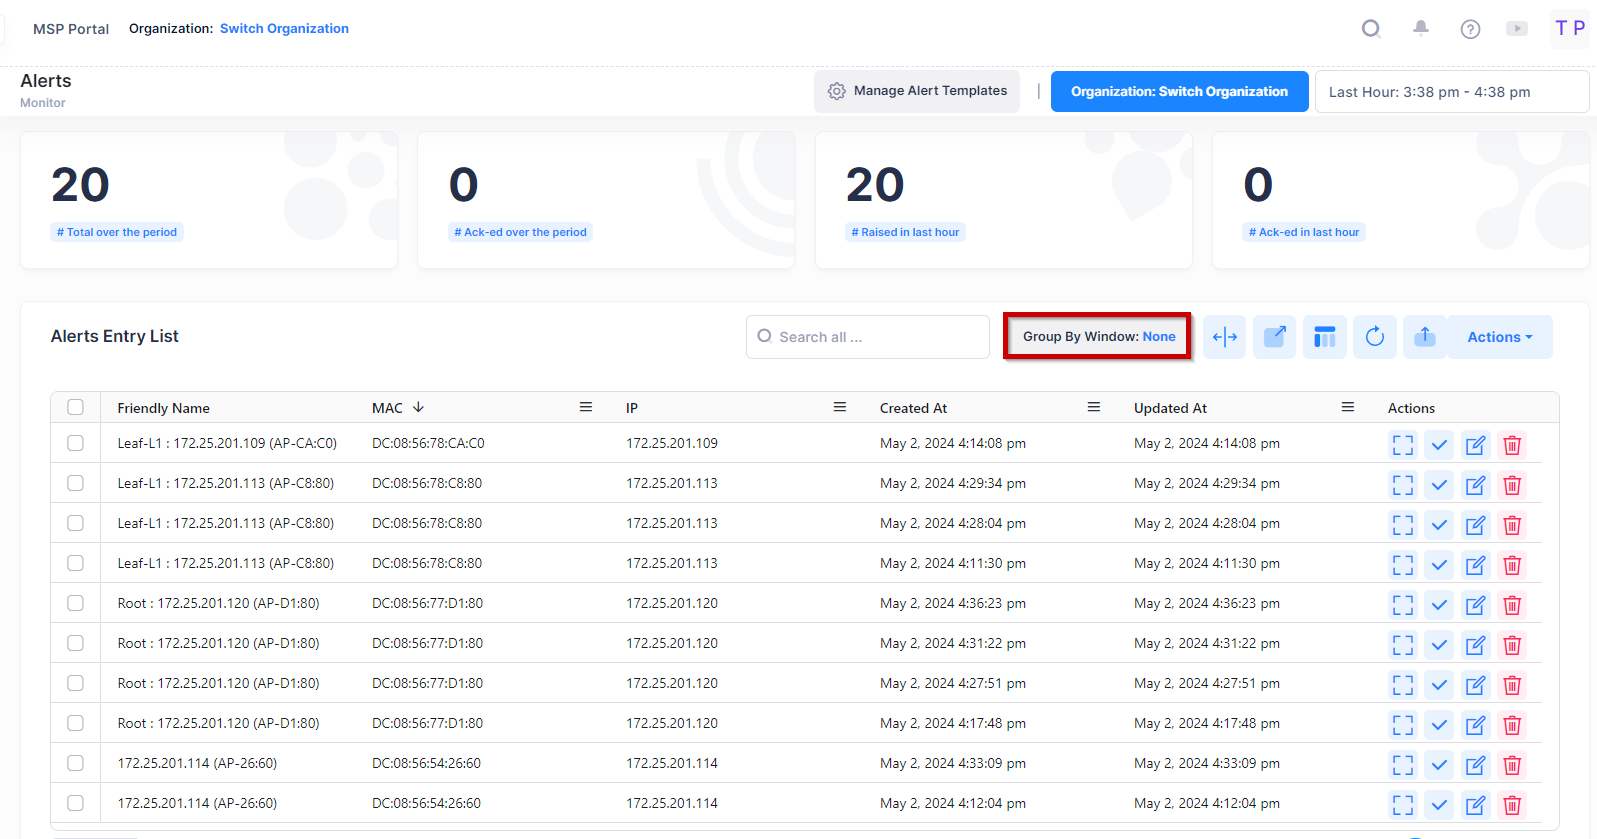
The top section of the Alerts screen provides a summary of alert activity during the specified time range. The bottom section of the screen is the Alerts Entry List, which displays the alerts generated based on the network device events and user configuration failure within the specified time range. You can also use the Alerts screen to acknowledge alerts, delete alerts, export alerts, and manage alert templates.
Viewing the Alerts Entry List
All Alerts from all devices within the Organization scope and specified timeframe are displayed and updated in real-time. New Alerts received are also indicated when a red blinking dot appears to the top of the bell icon on the Organization banner. For example:
The bell icon provides a list of recent 10 new traps and Alerts received. To view the list of traps, click on the bell icon, then on Alerts, AP Traps, or Switch Traps. A drop-down window displays the list of new Traps and Alerts.
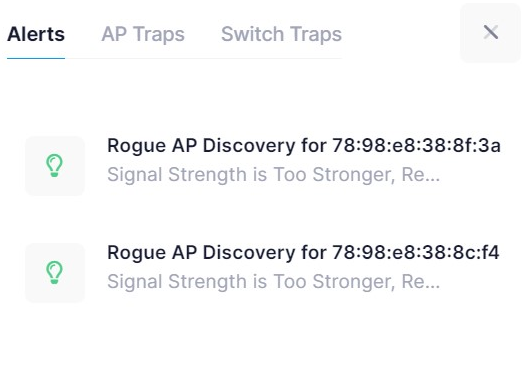
The dialog box displays the 10 most recent Alerts/Traps records. To view all the records or entries, you have to click on See All at the bottom of the drop-down list, then all Alerts/Traps are displayed on the screen.
View New Alerts Notification
When a new alert or trap is received, you will get a pop-up which is displayed on the top of the ‘Alerts Entry List’ table to indicate that the new alert has been raised as shown below:
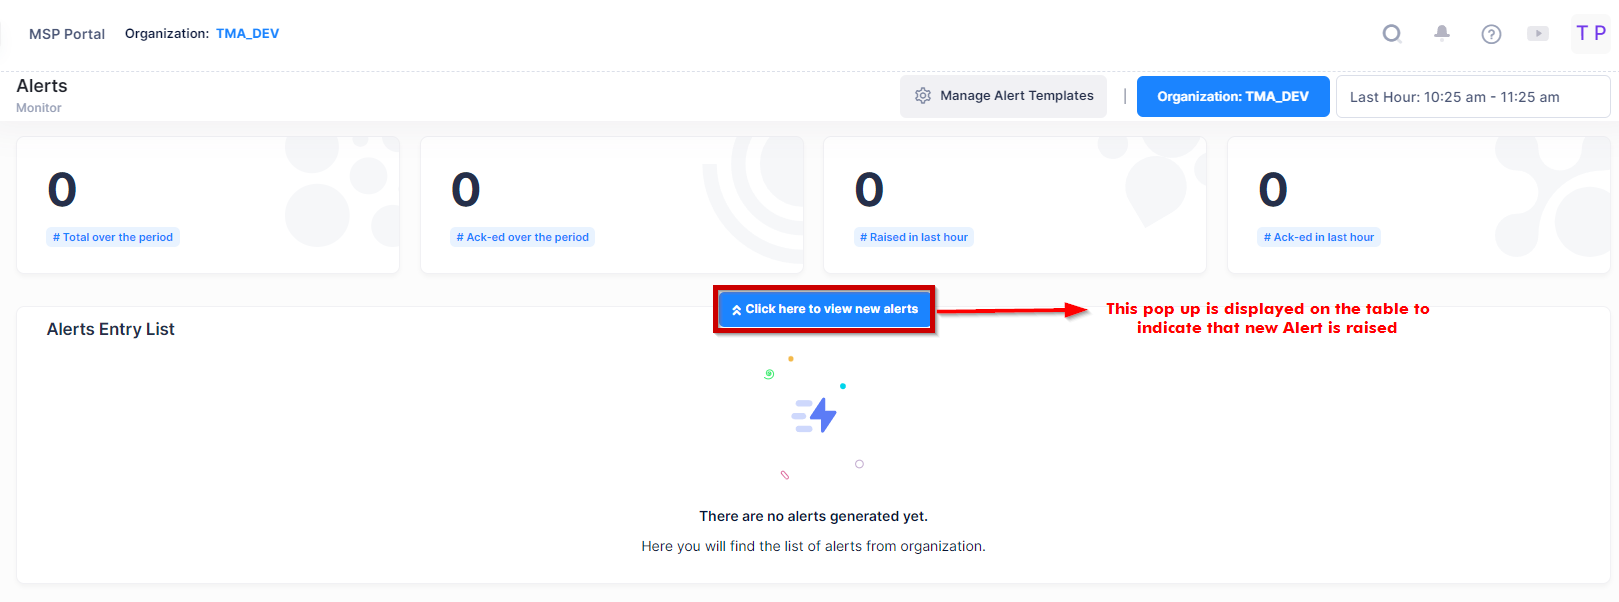
The above pop-up is displayed only when matching one of the below criteria:
-
When received alert matches the column filters.
-
When received alert matches the search filter.
-
When received alert falls under the selected scope entity.
-
When the time filter is selected other than the custom range. ( for example, last hour, last 6 hours, etc. )
The red blinking on the top of the bell icon is always displayed whenever a new alert or trap is received, irrespective of the mentioned criteria.
Alerts Entry List Information
The Alerts Entry List provides the following information for each alert received:
-
Alert Name - The name assigned to the alert.
-
Severity - The severity level (Minor/Major/Critical) of the alert.
-
Event/Cause - The specific alert generated based on which events (source) or which cause.
-
Status - Whether the alert is un-acknowledged (UnAck-ed) or acknowledged (Ack-ed).
-
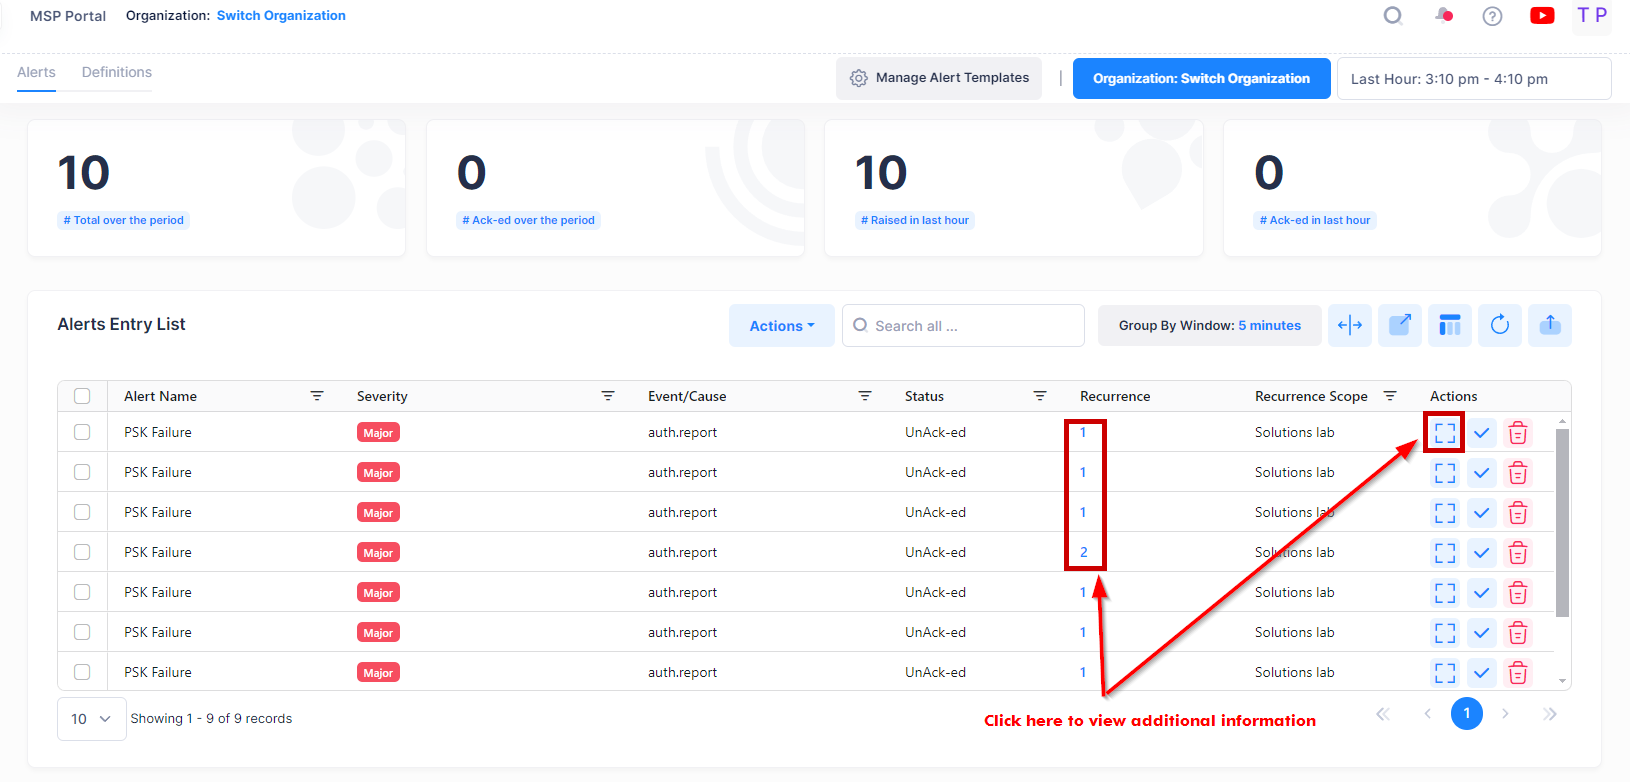
Recurrence - The number of alerts received for a specific alert type, from the selected Recurrence Scope, within the selected Group by Window range, and Acknowledged status. Click on the number in this field to view details for each recurrence of the alert type.
-
Recurrence Scope - Displays alerts from all devices in the Organization, Site, Building, Floor, or from a specific device. Use the display filter at the top of the Alerts screen to select which one of these entities to view.
-
Time of first alert- The date and time the alert was initially received.
-
Time of latest alert - The date and time the alert was last received.
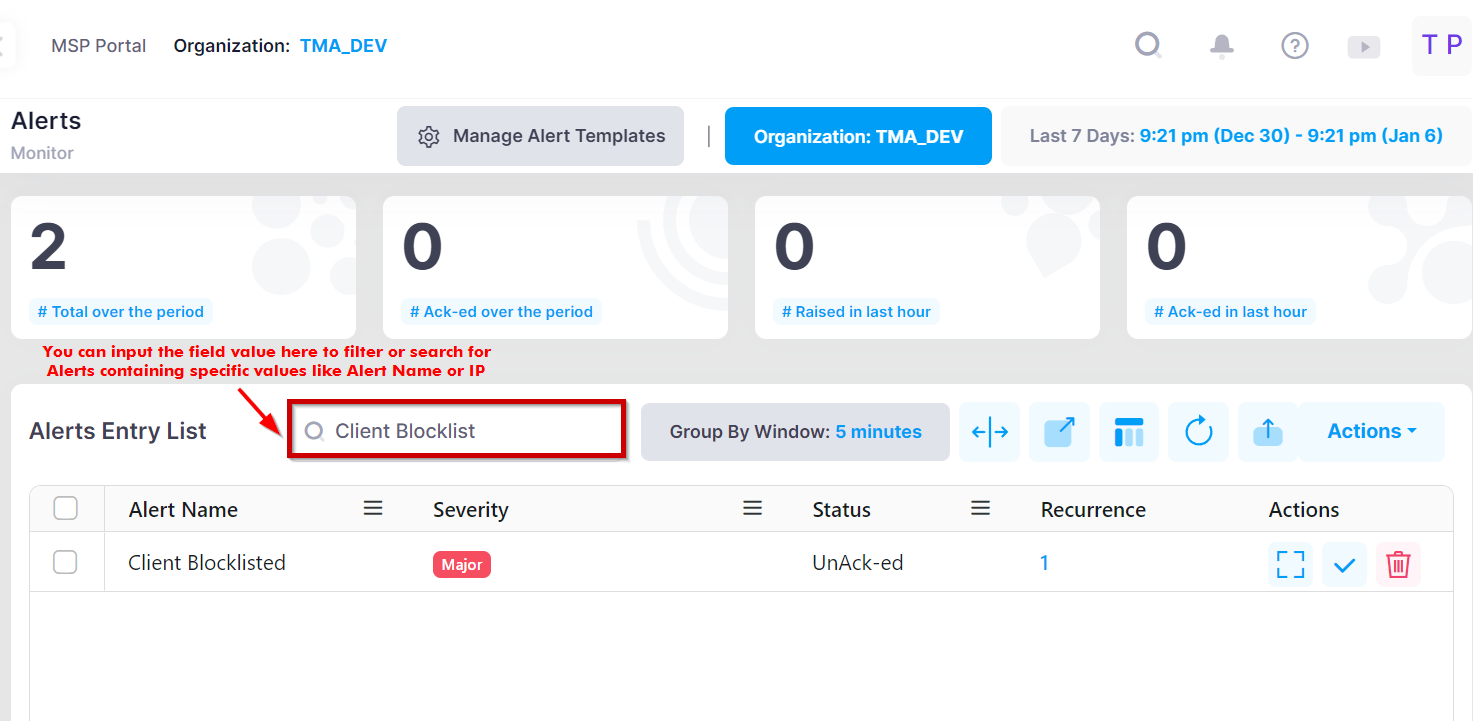
Tooltip: Use the Search box option to view the Alerts containing a specific Alert Name, severity, recurrence scope, IP address, reason, code, version, VAP, SSID, STAMAC or Client MAC. Usually, the Client MAC doesn’t appear in the Alerts List Table, but the search result will display all such Alerts containing a specific Client MAC as shown below:
Group by Window
The Group by Window display option allows you to select a range of time during which each type of alert received is counted. To select the time range for the Group by Window, click on Group by Window and select from 5 minutes (the default) up to 24 hours from the drop-down menu.
The total number of a specific alert type received within the Group by Window range is used to calculate the value reported in the “Recurrence” field. Value reported in the “Recurrence” field is based on Alert Name, Status, Recurrence Scope and Group by Window.
For example, if the Group by Window range is set to 24 hours and the Recurrence number for alert type “Port Auth Failure” is 12, then a “Port Auth Failure” alert was received 12 times during the 24-hour Group by Window range.
If you select the “None” option from the Group by Window drop-down menu, then it displays the detail view of the Alerts Entry List without any grouping of time range as shown below:
Display Additional Alerts Information
The Alerts Entry List displays entries grouped according to recurrence within the specified Group by Window time range. If you want to see a list of alert entries detail page, click on Recurrence column or Additional Information on “Actions” column next to a list entry to display detailed information for a specific Alert Entry.
The following screen will appears:
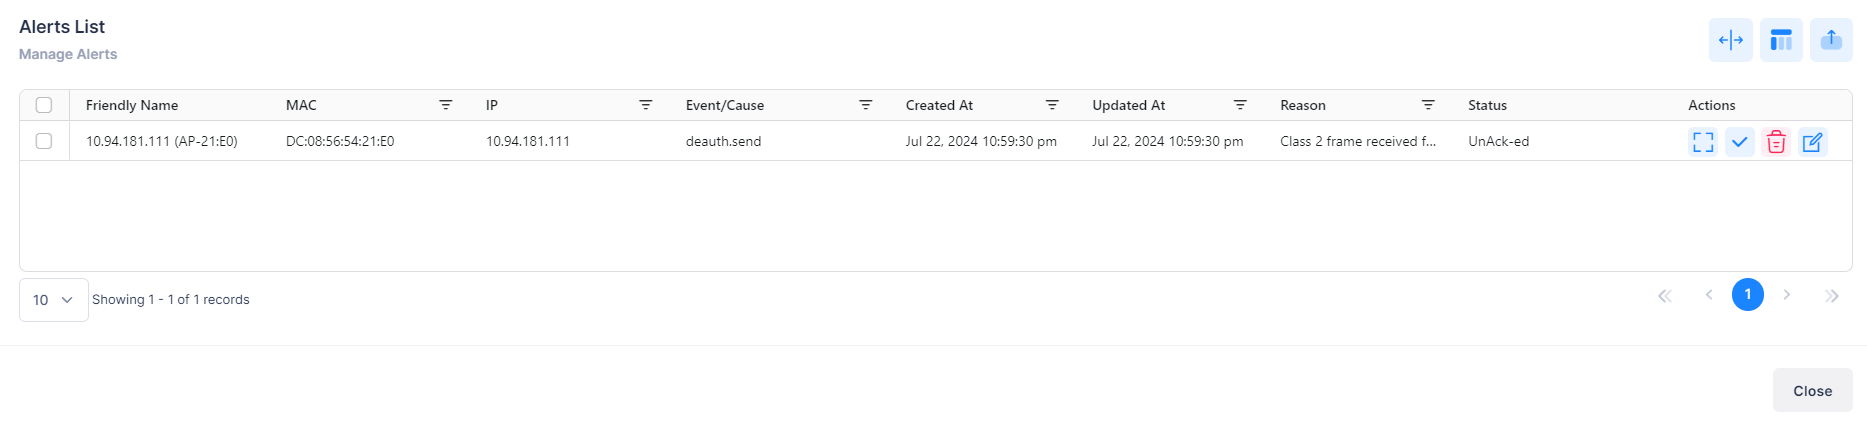
It provides the following information for each alert received:
-
Friendly Name - The name assigned to the device is derived from the Preferred Device Naming convention specified in the user preference settings. By default, the Friendly Name is set to IP Address (System Name).
-
MAC - The Access Point or Switch MAC address.
-
IP - The IP address of the AP or Switch device.
-
Created At - The date and time on which the alert was initially received.
-
Updated At - The date and time on which the alert was updated by the user.
-
Reason - The reason for the Alert.
-
Event/Cause - The specific alert generated based on which events (source) or which cause.
-
Status - Whether the alert is un-acknowledged (UnAck-ed) or acknowledged (Ack-ed).
-
STAMAC - The MAC address of the connected Client.
-
SSID - The name of the WLAN SSID.
-
VAP - The name of the WLAN interface.
-
Alert Name - The name assigned to the alert.
-
Severity - The severity level (Minor/Major/Critical) of the alert.
-
Code - The response status code of 802.11.
-
Notes - The notes for the alerts. (Notes can be updated by you through edit button in Actions column).
-
Version - The version of Access Point or Switch Interface.
Acknowledging Alerts
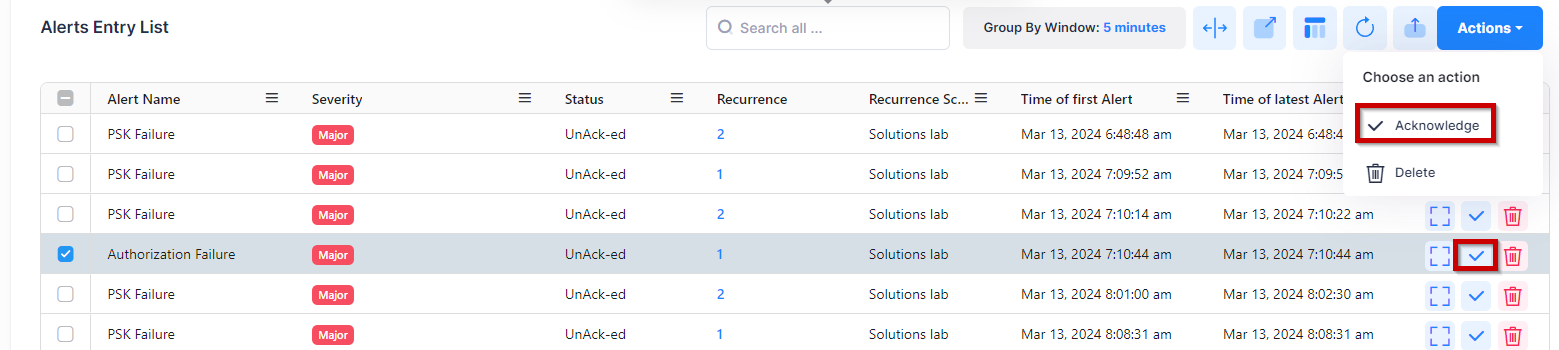
To acknowledge specific alerts, select one or more alerts in the Alerts Entry List, then select Acknowledge from the drop-down “Actions” menu or click on the checkmark next to the alert under the “Actions” column.
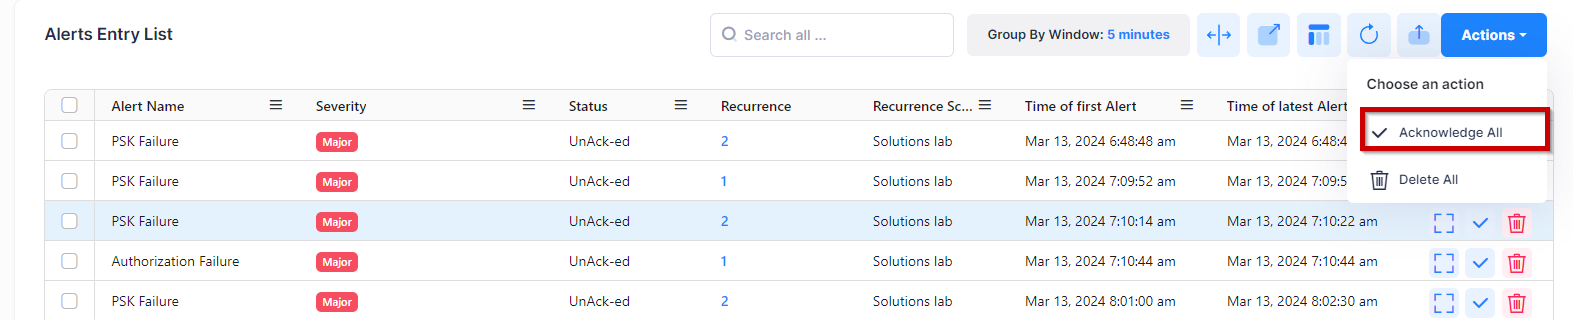
To quickly acknowledge all alerts, select Acknowledge All from the “Actions” drop-down menu. Note that this option is available only when there are no specific alerts selected within the list.
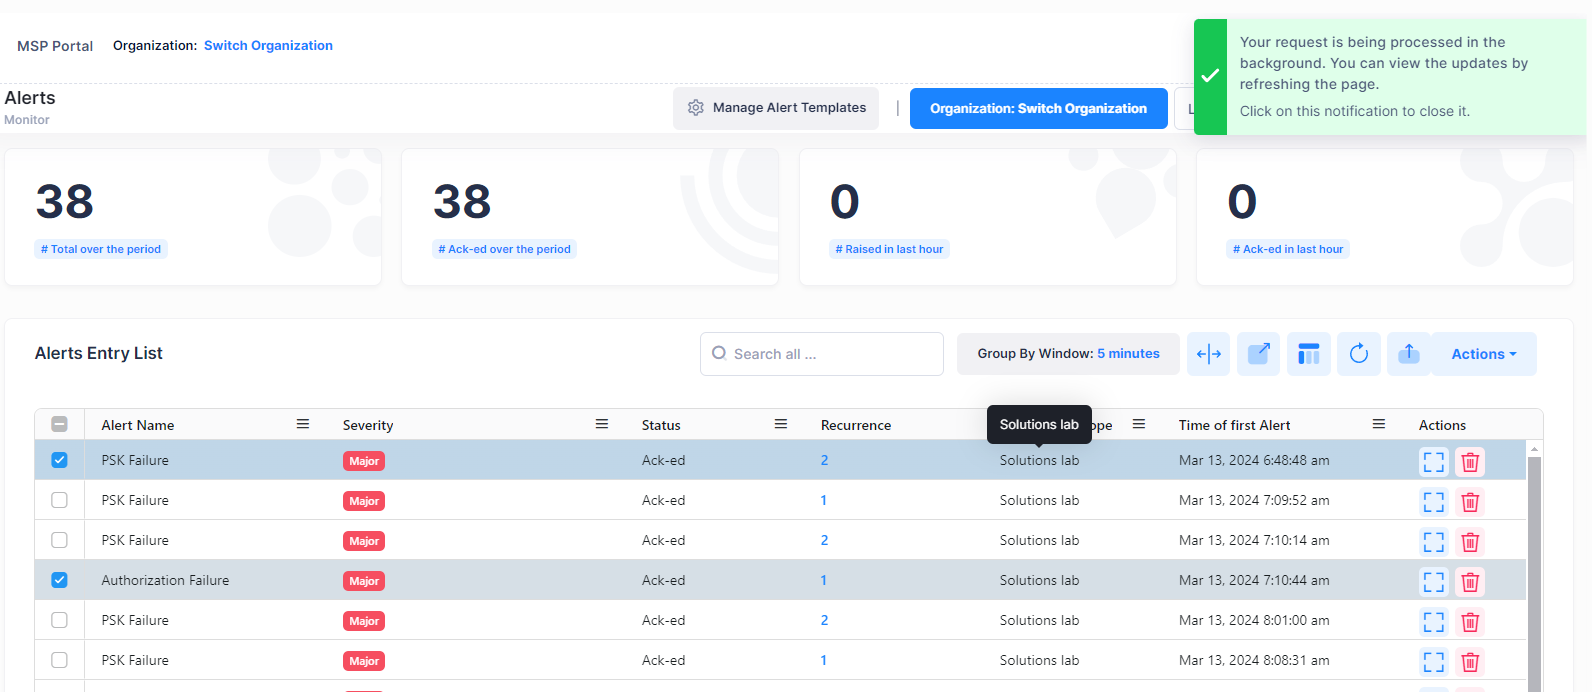
After you acknowledge an alert(s), the status for the alert(s) changes to Ack-ed.
During acknowledge all Alerts, the acknowledge Alerts operation is done in the background. You can view the updated results by clicking on the refresh button at certain time intervals as shown below.
Deleting Alerts
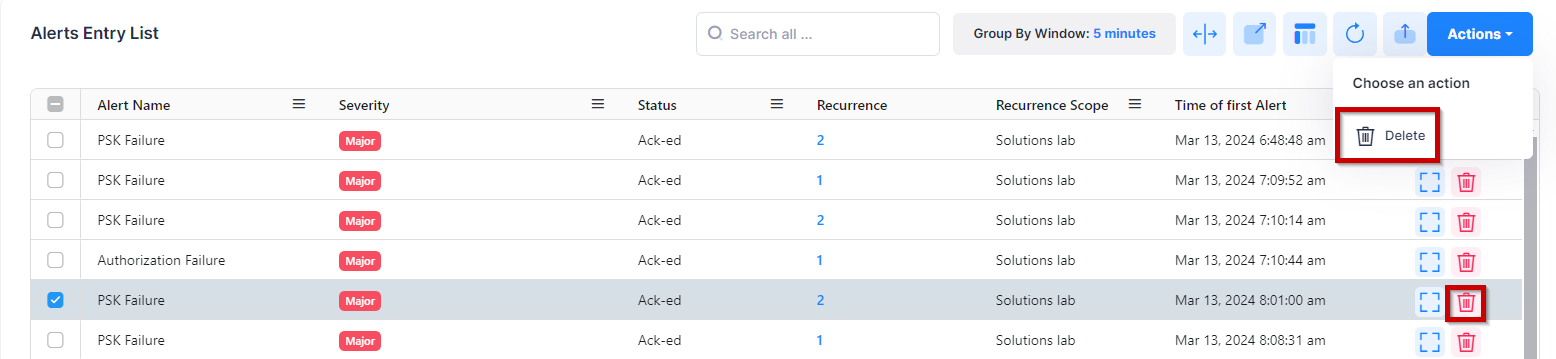
To clear specific alerts from the Alerts Entry List, select one or more alerts, then select Delete from the “Actions” drop-down menu or click on the Delete icon next to the alert under the “Actions” column.
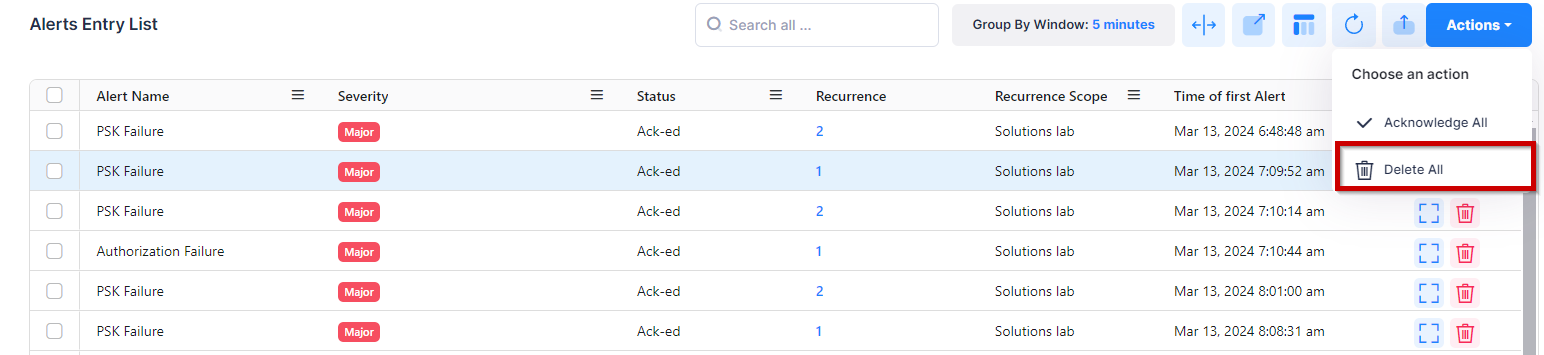
To clear all alerts from the Alerts Entry List, select Delete All from the “Actions” drop-down menu. Note that this option is available only when there are no specific alerts selected within the list.
During delete all Alerts, the delete Alerts operation is done in the background. You can view the updated results by clicking on the refresh button at certain time intervals.
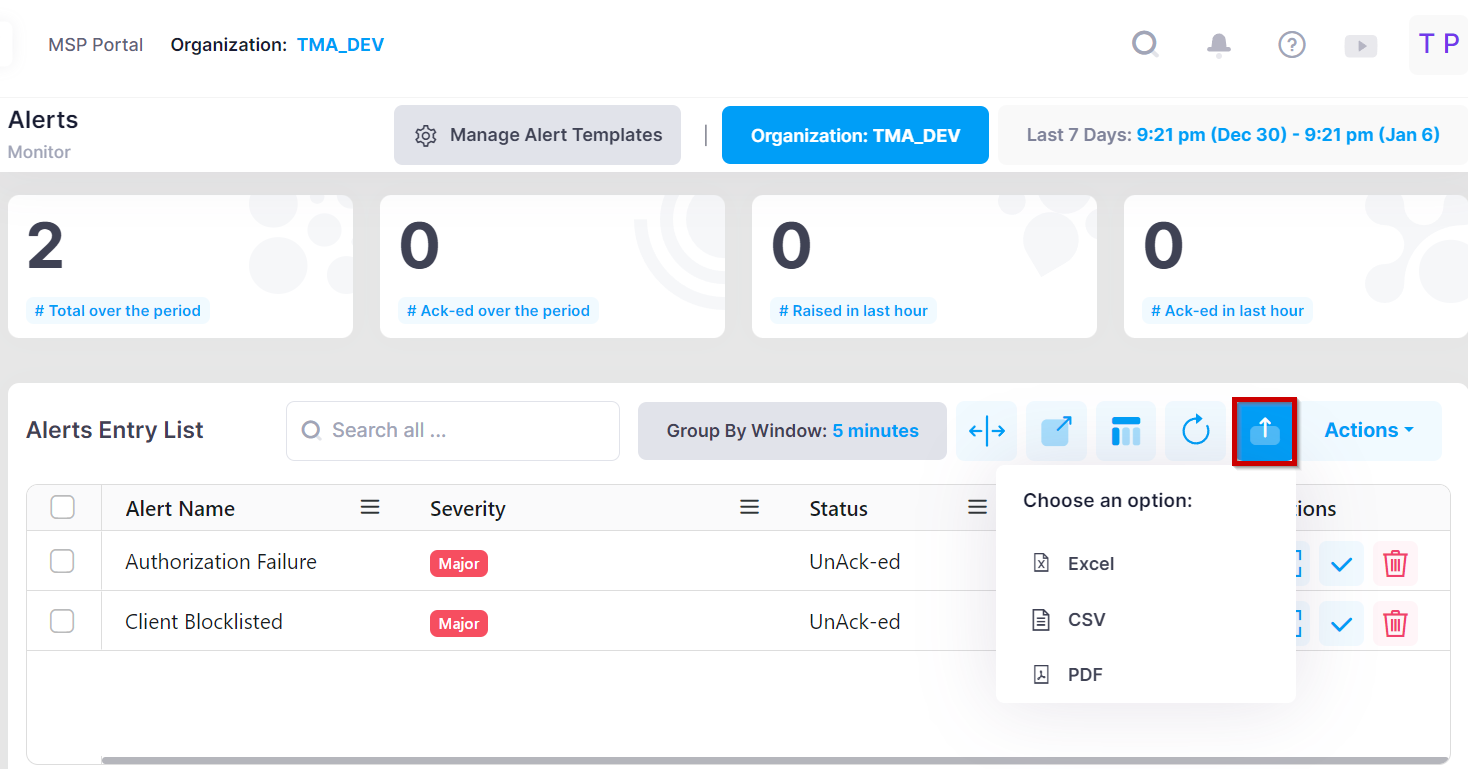
Export Alerts
To export multiple Alerts from an existing Alerts Entry List, click on the Export tab and select one of the available options to export the data in an Excel, CSV or PDF file format as shown below.
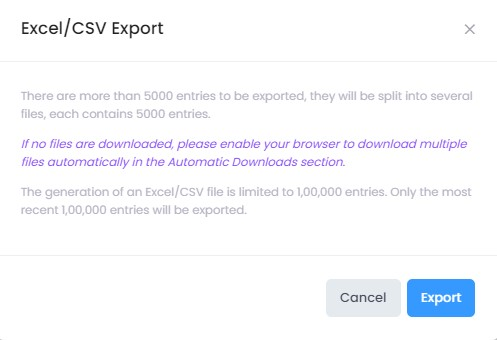
You will then be prompted to a dialog box that displays the notification that if there are more than 5000 entries to be exported, then the data will be split into multiple files, each containing 5000 entries. Also there is a limitation on the browser level to export only the latest 1,00,000 data entries for a chosen scope and time.
Alert Event Source List
The following table displays the list of Alerts with the Event or Cause related to that specific Alert. You can view the Event/Cause for the specific Alert on the summary and detail page of the Alert Entry List.
|
Alerts Name |
Event Source |
|---|---|
|
DHCP Failure |
dhcp.nack |
|
DHCP Declined |
dhcp.decline |
|
EAP/802.1x Failure |
auth.response |
|
auth.report |
|
|
MAC Auth Failure |
mac-auth.response |
|
mac-auth.timeout |
|
|
auth.report |
|
|
PSK Failure |
auth.report |
|
Association Failure |
assoc.response |
|
auth.report |
|
|
Deauth |
deauth.send |
|
deauth.recv |
|
|
DisAssoc |
disassoc.send |
|
disassoc.recv |
|
|
Reassoc Failure |
reassoc.response |
|
Roaming Failure |
roam.report |
|
Portal Auth Failure |
portal.report |
|
Portal Session Timeout |
portal.session-timeout |
|
Portal Auth Timeout |
portal.auth-timeout |
|
Portal Idle Timeout |
portal.idle-timeout |
|
Authorization Failure |
auth.response |
|
auth.report |
|
|
Rogue AP Discovery |
aprogueinfo.report |
|
Rogue AP Cleared |
aprogueinfo.report |
|
Client Blocklisted |
aprogueclient.report |
|
AP License Installed Alert |
apLicenseInstalledAlert |
|
AP License Mode Changed Alert |
apLicenseModeChangedAlert |
|
AP License No Connectivity Alert |
apLicenseNoConnectivityAlert |
|
AP Naas Expiry Day Alert |
apNaasExpiryDayAlert |
|
AP Naas Degraded State Alert |
apNaasDegradedStateAlert |
|
Apply configuration to AP/Switch Failure |
Different cause based on module |
|
Configuration backup failed |
backup |
|
Configuration backup partial failure |
backup |
|
Golden configuration setup failed |
audit |
|
Golden configuration drift detected |
audit |
|
Failed to perform golden configuration audit |
audit |
Managing Alert Templates
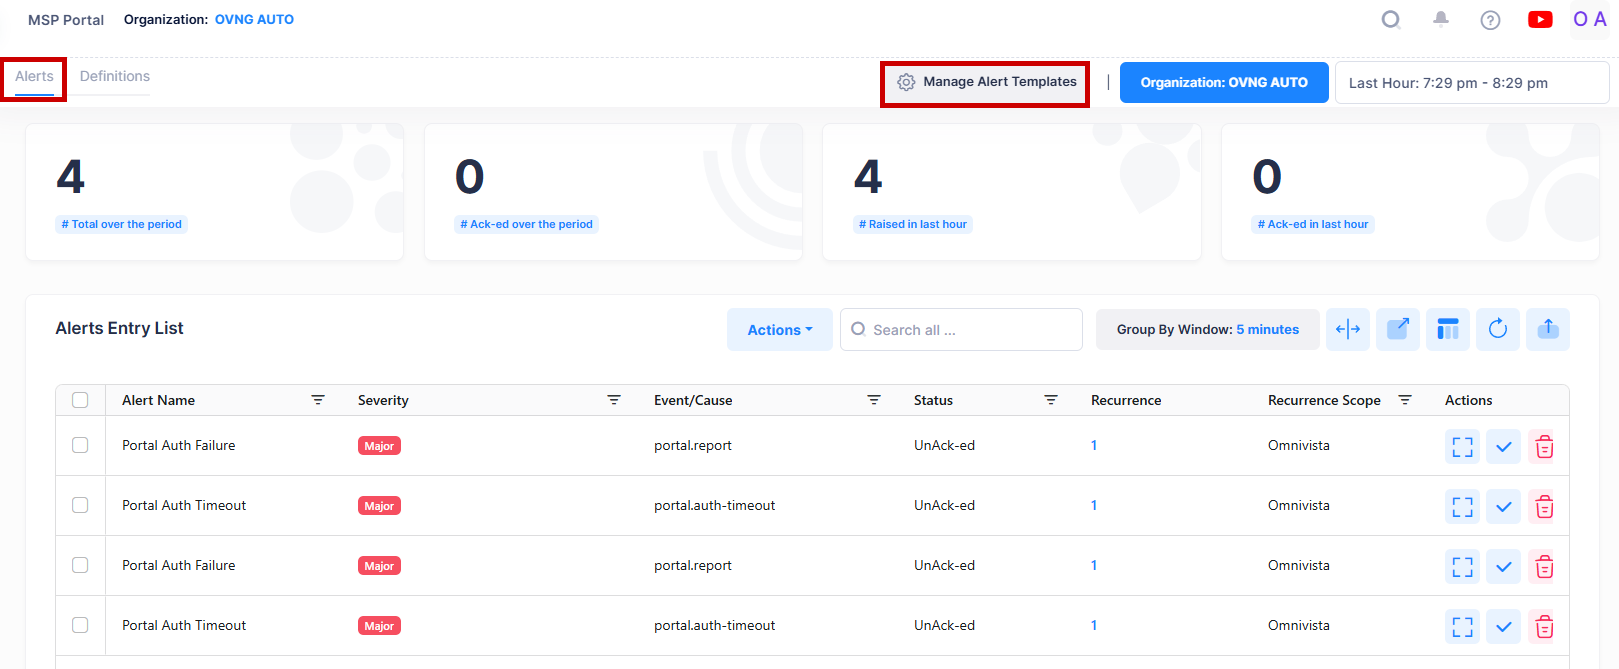
OmniVista Cirrus initially uses a default alert template (“DefaultTemplate_0) to determine which alerts to report on the Alerts Entry List. The default template is configured to report on all the selected alert types received from devices within all Sites of an Organization. You cannot delete the “DefaultTemplate_0” template but you can edit the default template attributes (for example, name, scope, and alert types) or define a new template to override the default template.
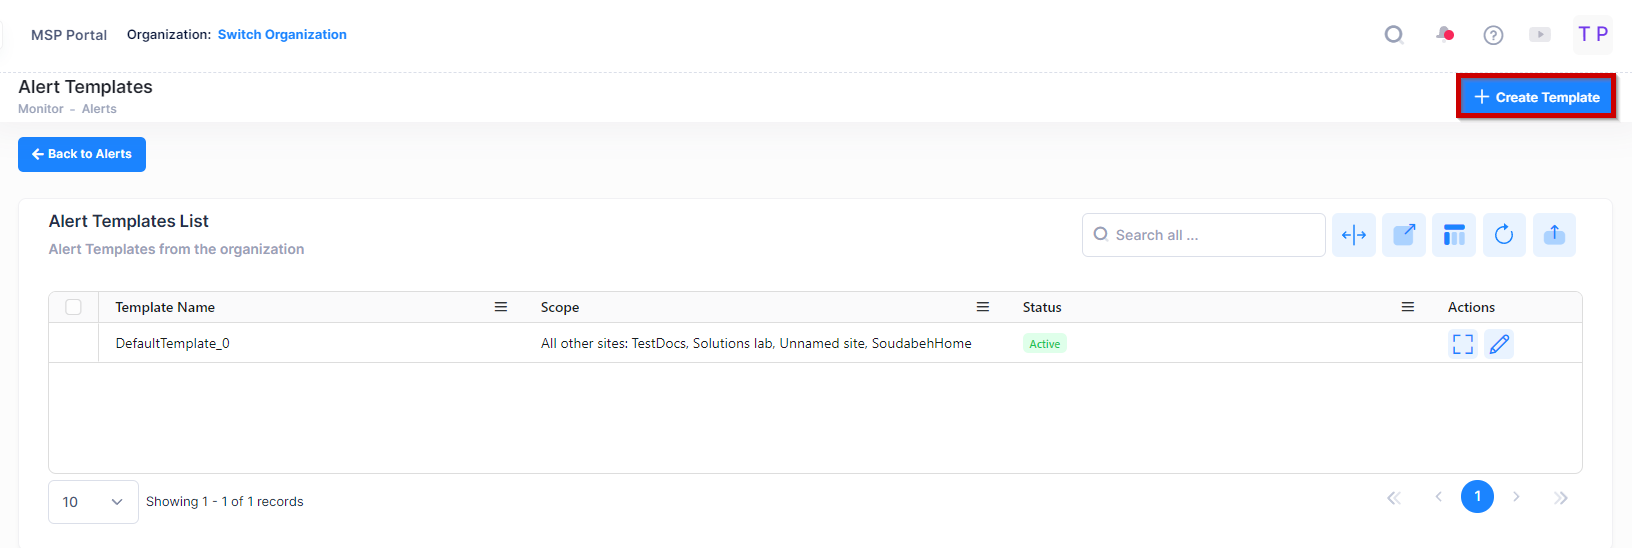
To view the active alert template, click on Manage Alert Templates at the top of the Alerts screen as shown below:
The Alert Templates List screen opens.
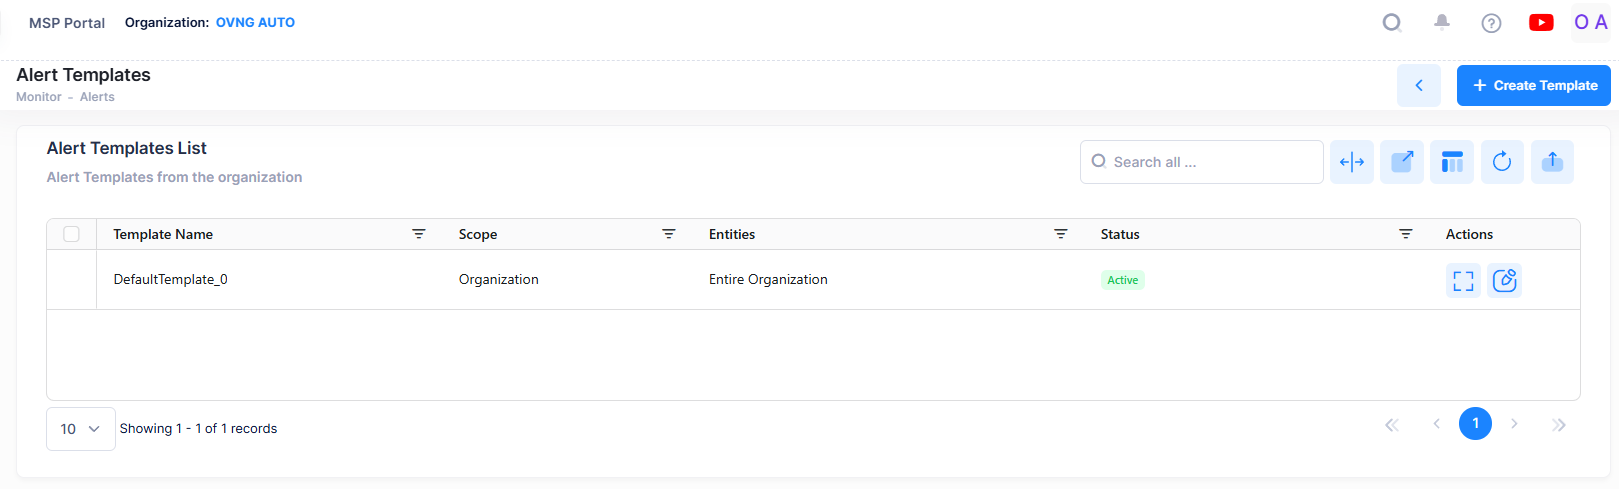
The following information is provided for the template:
-
Template Name - The name assigned to identify the alert template.
-
Scope - Report the selected alerts received from all Sites within the Organization or only from specific Sites within the Organization.
-
Status - Whether the template is active or inactive.
Create a New Template
To create a new template, go to Monitor > Alerts > Manage Alert Templates and click on Create Template on the Alert Templates List screen.
The Create Alert Template screen opens.
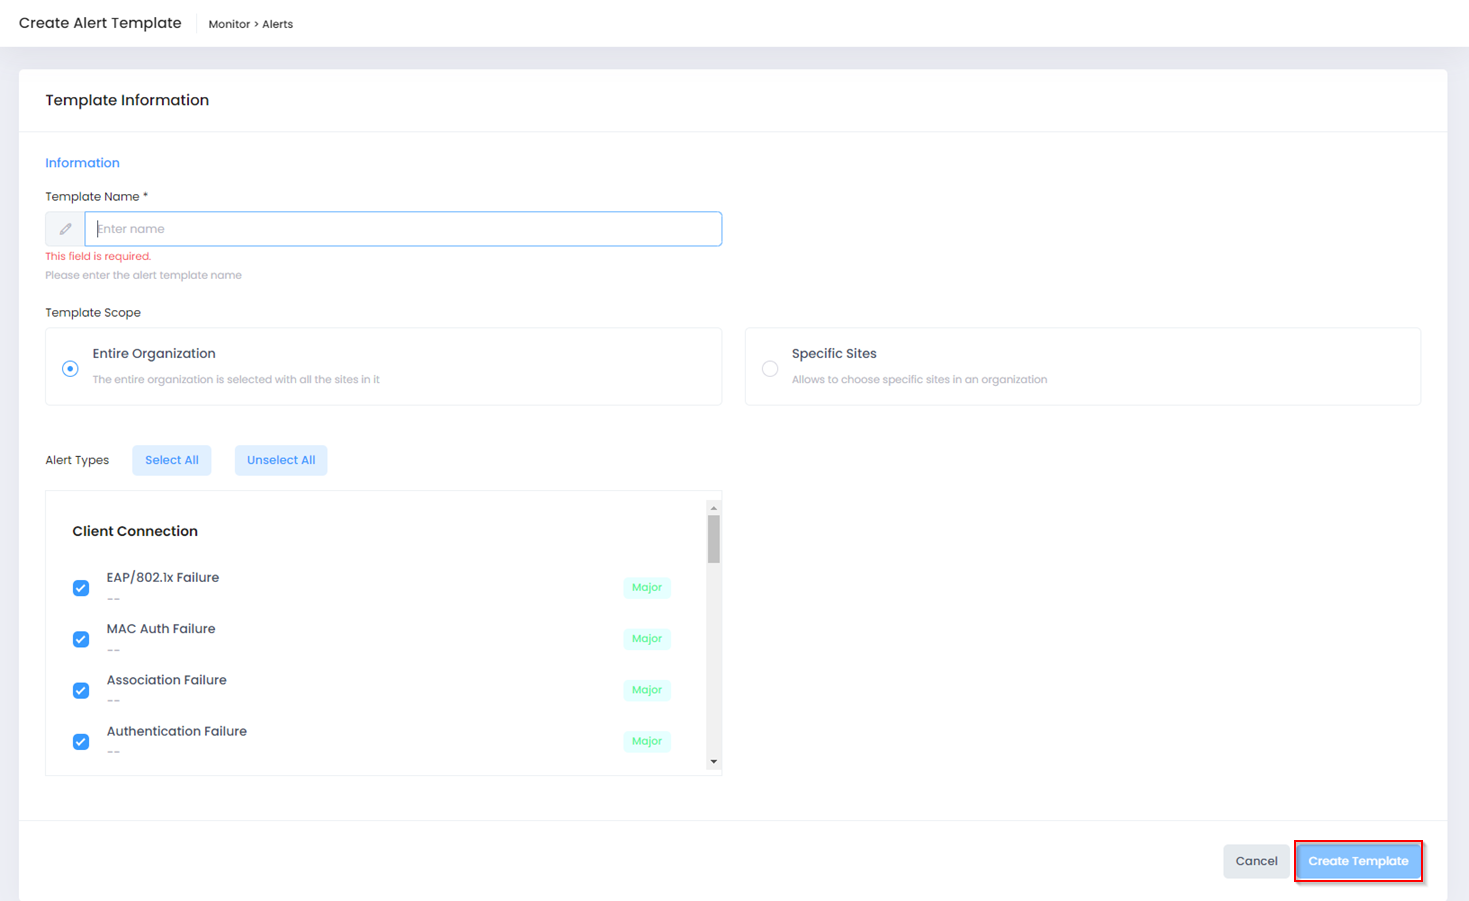
Complete the following fields as described:
-
Template Name - Enter a name to assign to the new template.
-
Template Scope - Select Entire Organization (the default) or Specific Sites.
-
Alert Types - Select the alert types that you want to view on the Alerts Entry List. By default, all alerts are selected.
After you have finished configuring the new template, click Create Template. You are then prompted to confirm overriding the existing template with the new template.
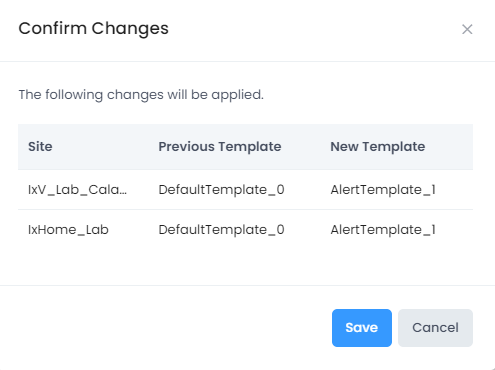
Click Save to confirm. The new template becomes the only “active” template and the old template is “inactive”.
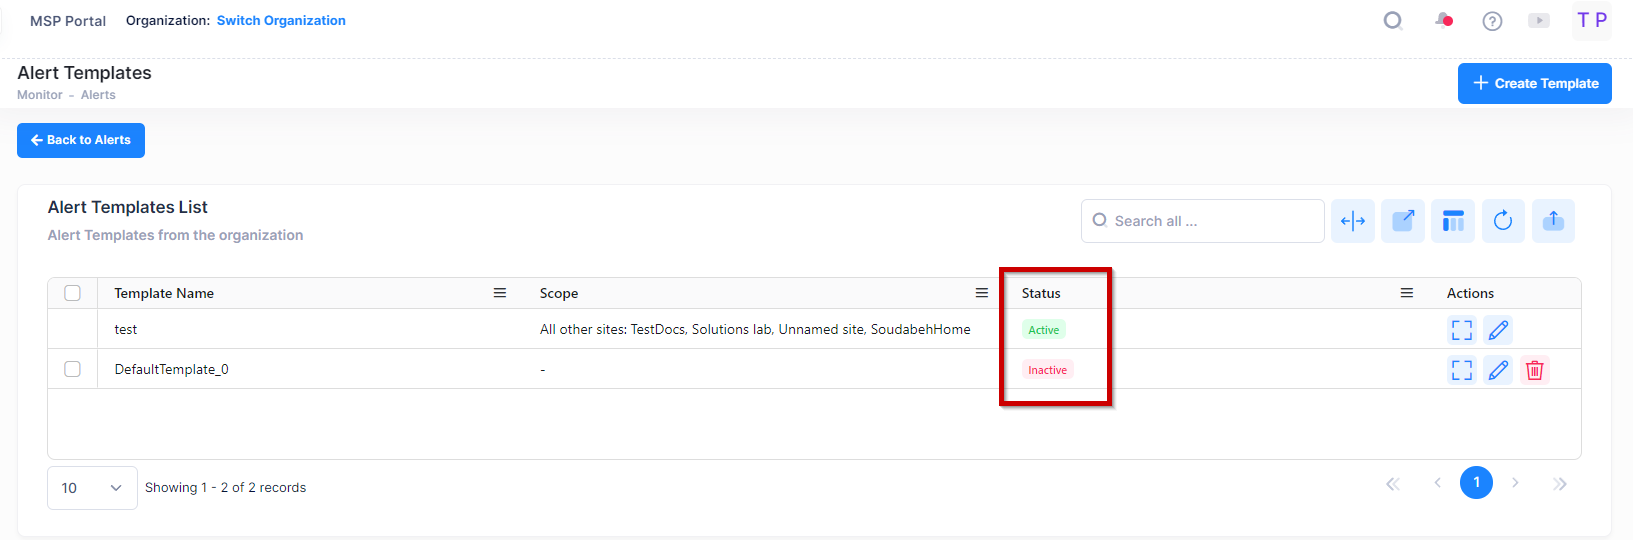
When a new template is created, you are prompted to confirm that the new template settings will override the existing active template settings within the same time scope. There can only be one active template at a given time for a specific time scope.
For the “Alert Templates”, follow the following use cases:
-
You can not delete the template with Entire Organization.
-
If a site is configured with a specific template, it will use the site template.
-
If a site does not have a template, it will follow the Entire Organization template.
You can view the updated new severity levels of Alerts in the Manage Alert Templates list by navigating to following screen, Monitor > Alerts > Manage Alert Templates > Actions > Edit.
Alert Types
The following alert types are available for you to select when creating or editing an alert template:
|
Client Connection |
WIPS |
NaaS |
Audit |
Backup |
Configuration |
|---|---|---|---|---|---|
|
EAP/802.1X Failure (Major) MAC Auth Failure (Major) Association Failure (Major) Authentication Failure (Major) Deauth Failure (Major) Disassoc Failure (Major) Reassoc Failure (Major) Roaming Failure (Major) Portal Auth Failure (Major) Portal Session Timeout (Major) Portal Auth Timeout (Major) Portal Idle Timeout (Major) PSK Failure (Major) Authorization Failure (Major) DHCP Failure (Major) DHCP Declined (Major) |
Rogue AP Discovery (Minor) WIDS Event (Minor) Rouge AP Cleared (Minor) Client Blocklisted (Major) |
AP License Installed Alert (Major) AP License Mode Changed Alert (Major) AP License No Connectivity Alert (Critical) AP NaaS Expiry Day Alert (Critical) AP NaaS Degraded State Alert (Major) |
Failed to perform golden configuration audit (Major) Golden configuration setup failed (Major) Golden configuration drift detected (Major) |
Configuration backup partial failure (Minor) Configuration backup failed (Major) |
Fail to apply the configuration to AP/Switch (Major) |
Sites-based Alert templates will have a higher precedence than Organization-based Alerts templates.