The Network Events screen displays configured events received from network devices and provides basic event information (for example, severity, date/time received).
To access the Network Events screen, click on Diagnostic Tools > Network Events and select the Events tab under the “Monitor” section of the OmniVista Cirrus Menu.
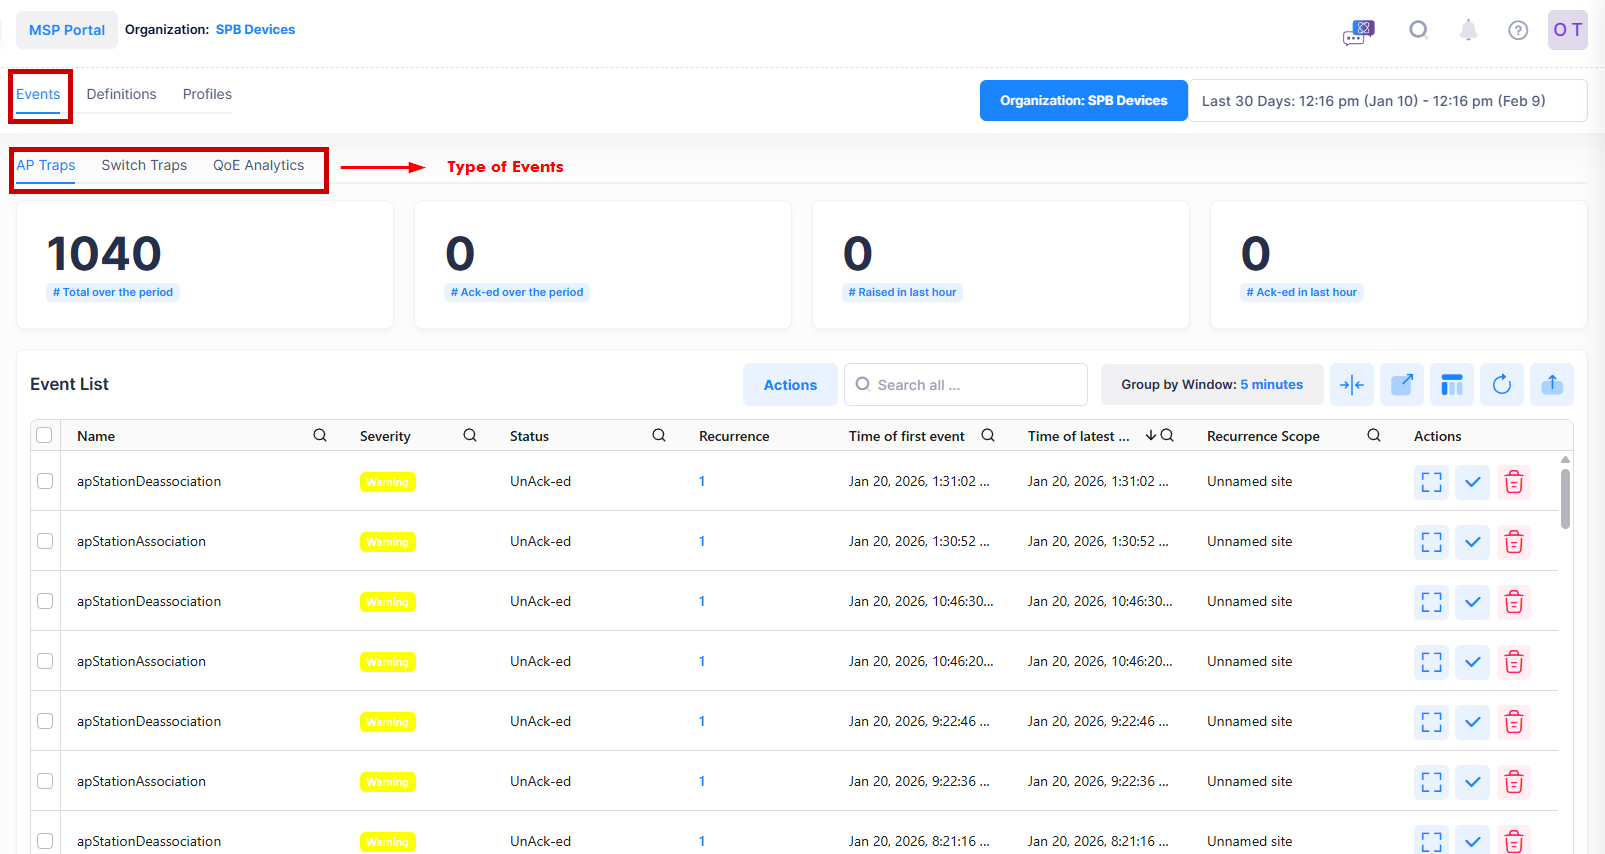
The top section of the Network Events screen provides a summary of event activity during the specified time range based on type of Events. The bottom section of the screen is the Events List, which displays the events received within the specified time range. You can also use the Events list to acknowledge or delete events.
Viewing the Events List
All event notifications from all devices within the Organization scope and specified timeframe are displayed and updated in real-time. As you scroll the the list of events and a new event is received, a “Click here to view new events” message will appear. Click on the message to return to the top of the list to view the new events.
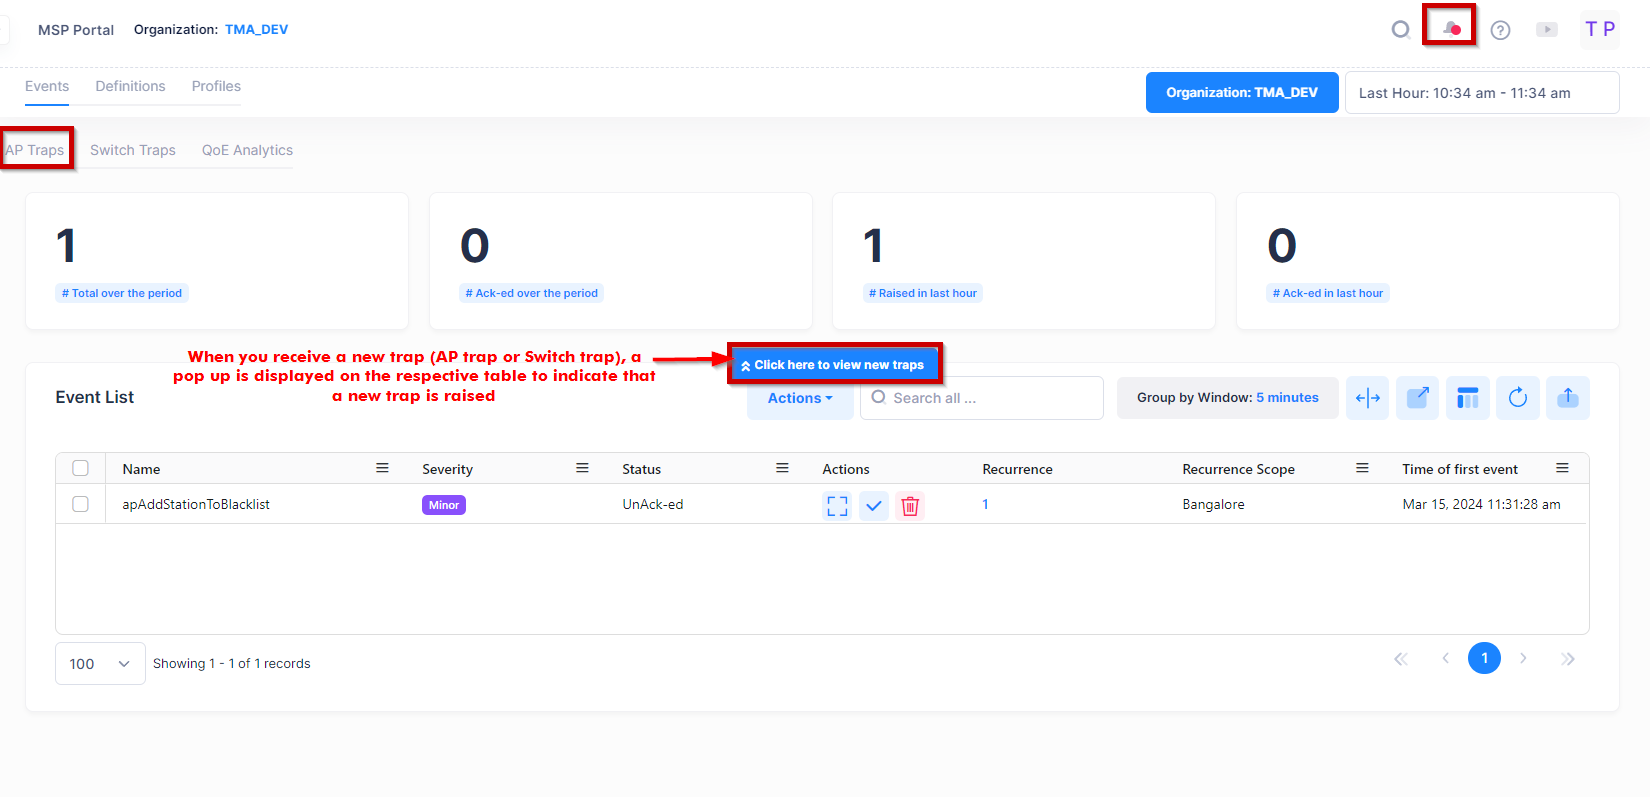
New events received are also indicated when a red blinking dot appears to the top of the bell icon on the Organization banner. For example:
The bell icon provides a list of recent 10 new traps and alerts received. To view the list of traps, click on the bell icon, then on AP Traps. A drop-down window displays the list of new Traps and Alerts.
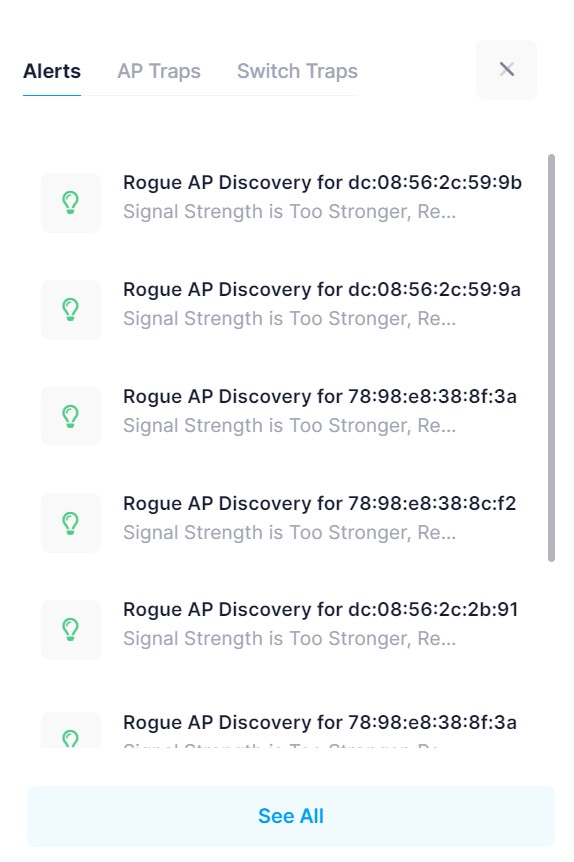
If you click on See All at the bottom of the drop-down list, the Network Events screen is displayed.
View New Events Notification
When a new event is received, you will get a pop-up which is displayed on the top of the Event List table to indicate that the new trap (AP trap or Switch trap) has been raised as shown below:
The above pop-up displays only when one of the below criteria is matched:
-
Received trap matches the column filters.
-
Received trap matches the search filter.
-
Received trap falls under the selected scope entity.
-
The time filter is selected other than the custom range. ( for example, last hour, last 6 hours, etc. )
Note: The red blinking dot on the top of the bell icon displays whenever a new trap is received, irrespective of the mentioned criteria.
Events List Information
The Events List provides the following information for each event received:
-
Name - The name of the trap as defined in the respective MIB.
-
Severity - The severity level (Normal/Warning/Minor/Major/Critical) assigned to the event, as shown on the Events Definitions screen . Note that you can edit the severity level of an event using the Events Definitions screen.
-
Status - Whether the event is un-acknowledged (UnAck-ed) or acknowledged (Ack-ed).
-
Recurrence - The number of times the event was received, from the selected Recurrence Scope, in the selected Group by Window range within the specified time frame. Click on the number in this field to view details for each recurrence of the event type.
-
Recurrence Scope - Displays events from all devices in the Organization, Site, Building, Floor, or from a specific device. Use the display filter at the top of the Network Events screen to select which one of these entities to view.
-
OID - The trap object identifier number.
-
Time of first event - The date and time the event was initially received.
-
Time of latest event - The date and time the event was last received.
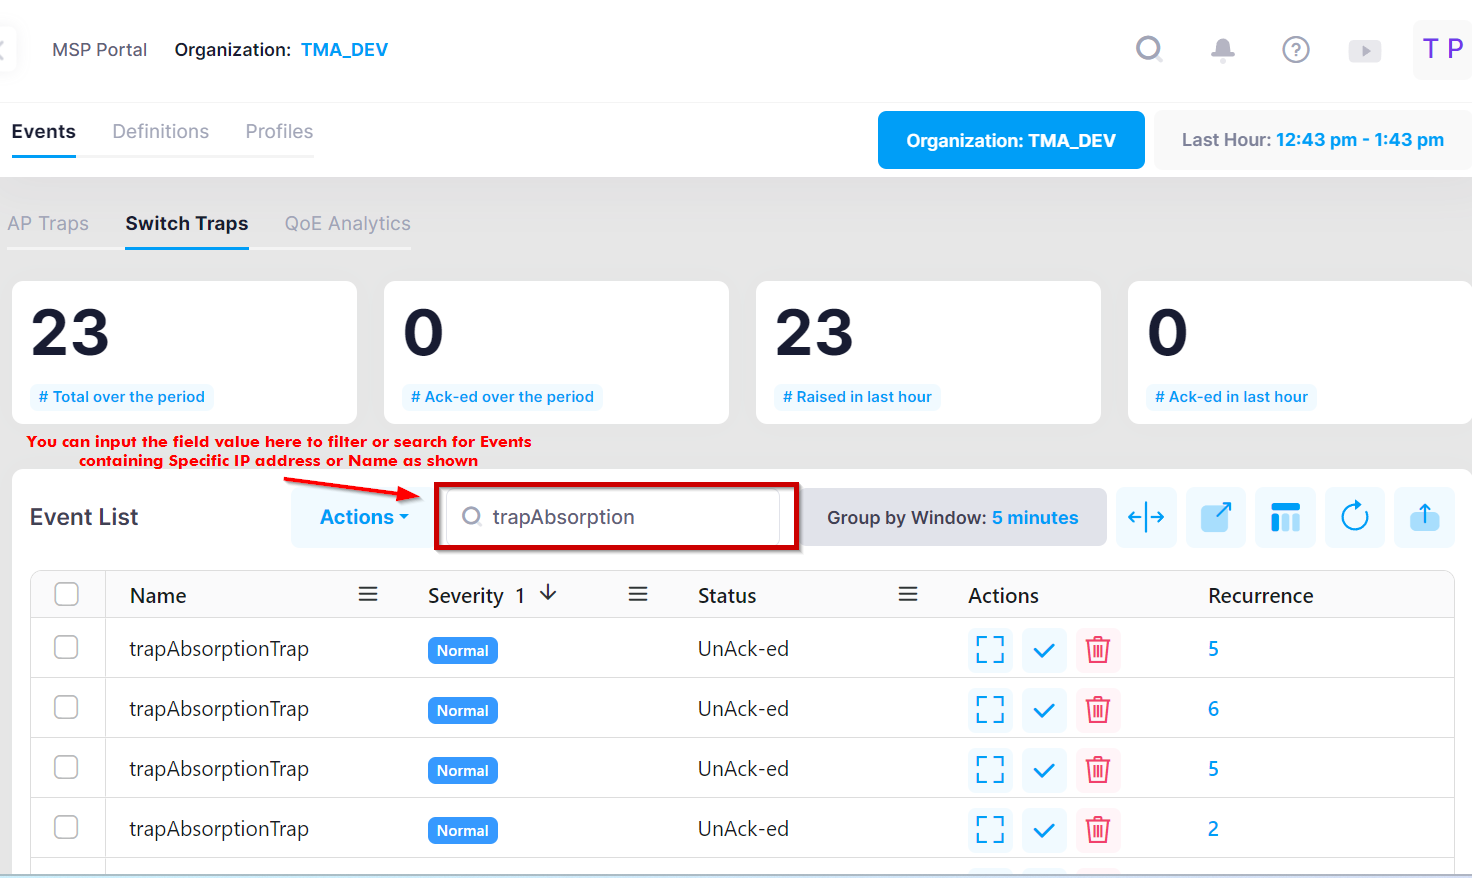
ToolTip : Use the Search box option to view the Events containing a specific Name, Severity, type, Recurrence scope, source IP, synopsis or Client MAC. Usually, the Client MAC doesn’t appear in the Event List Table, but the search result will display all such Events containing a specific Client MAC or Source IP as shown below:
Types of Event Notifications
AP Traps - The AP Traps are the notification events from the devices. To access the AP Traps screen, go to Network Events > Events and click on AP Traps as shown below.
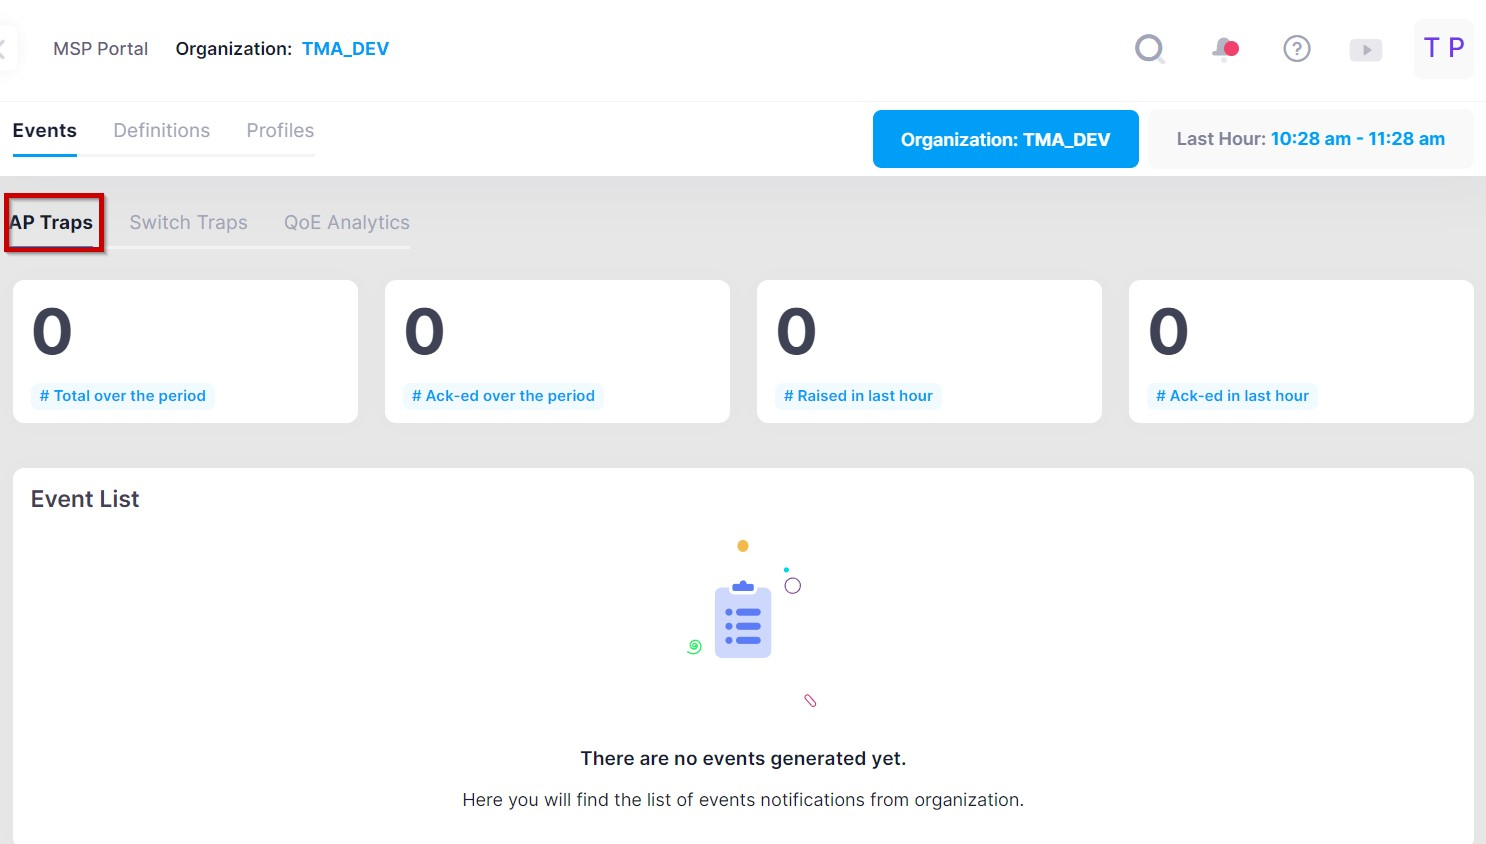
The top section of the AP Traps screen provides a summary of Traps activity during the specified time range based on type of Events. The bottom section of the screen is the Events List, which displays the events received within the specified time range.
Note: For AP Traps, the maximum time range that you can specify to view Event Notifications is 15 days. You cannot use the custom range option to view Traps metrics for more than 15 days.
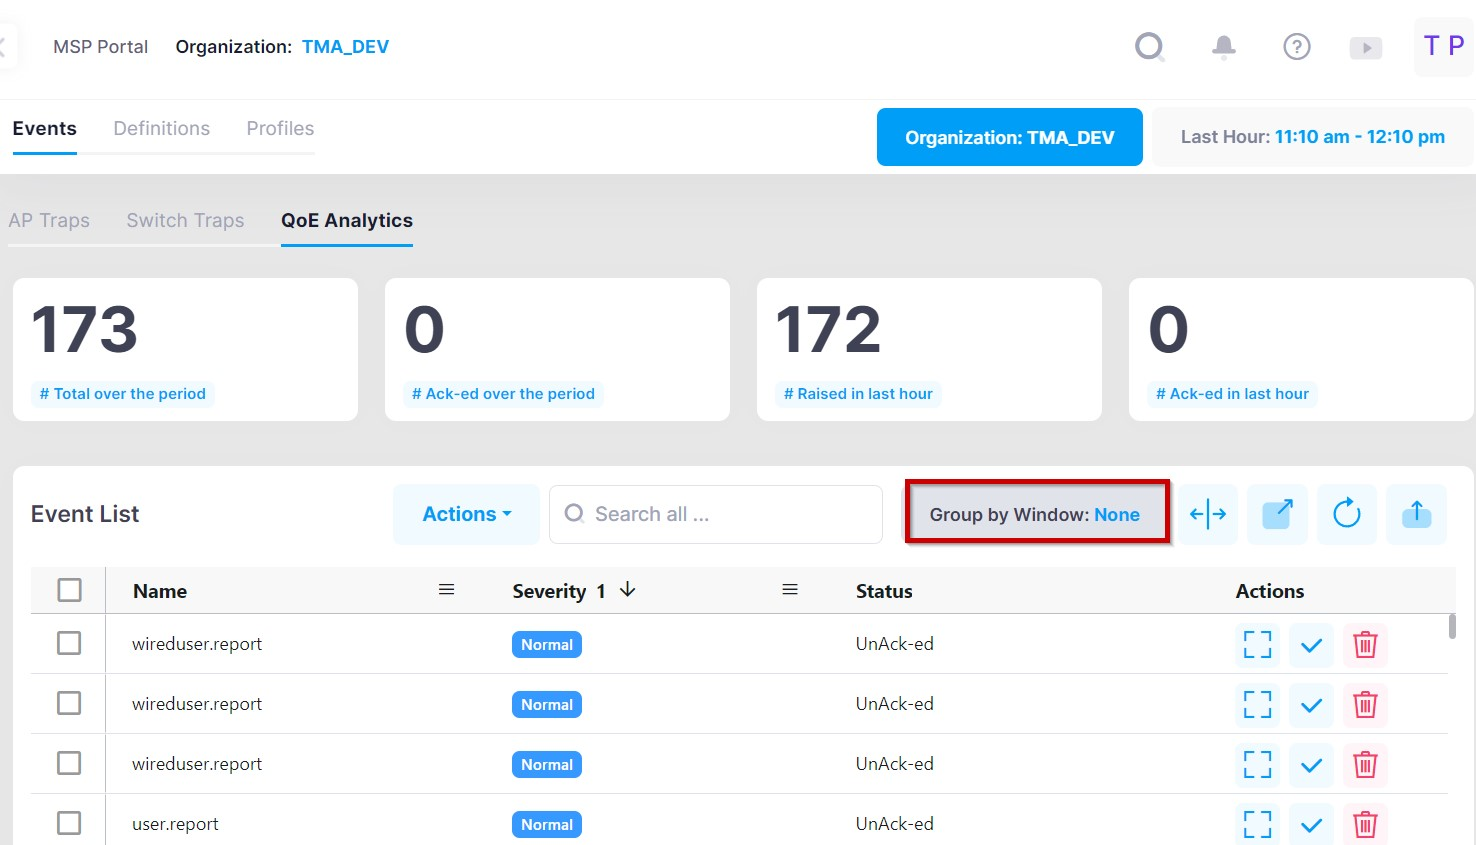
QoE Analytics - The QoE Analytics events are the events from devices that are sent to OmniVista Cirrus 10 for monitoring and analysis. To access the QoE Analytics screen, go to Network Events > Events and click on QoE Analytics as shown below.
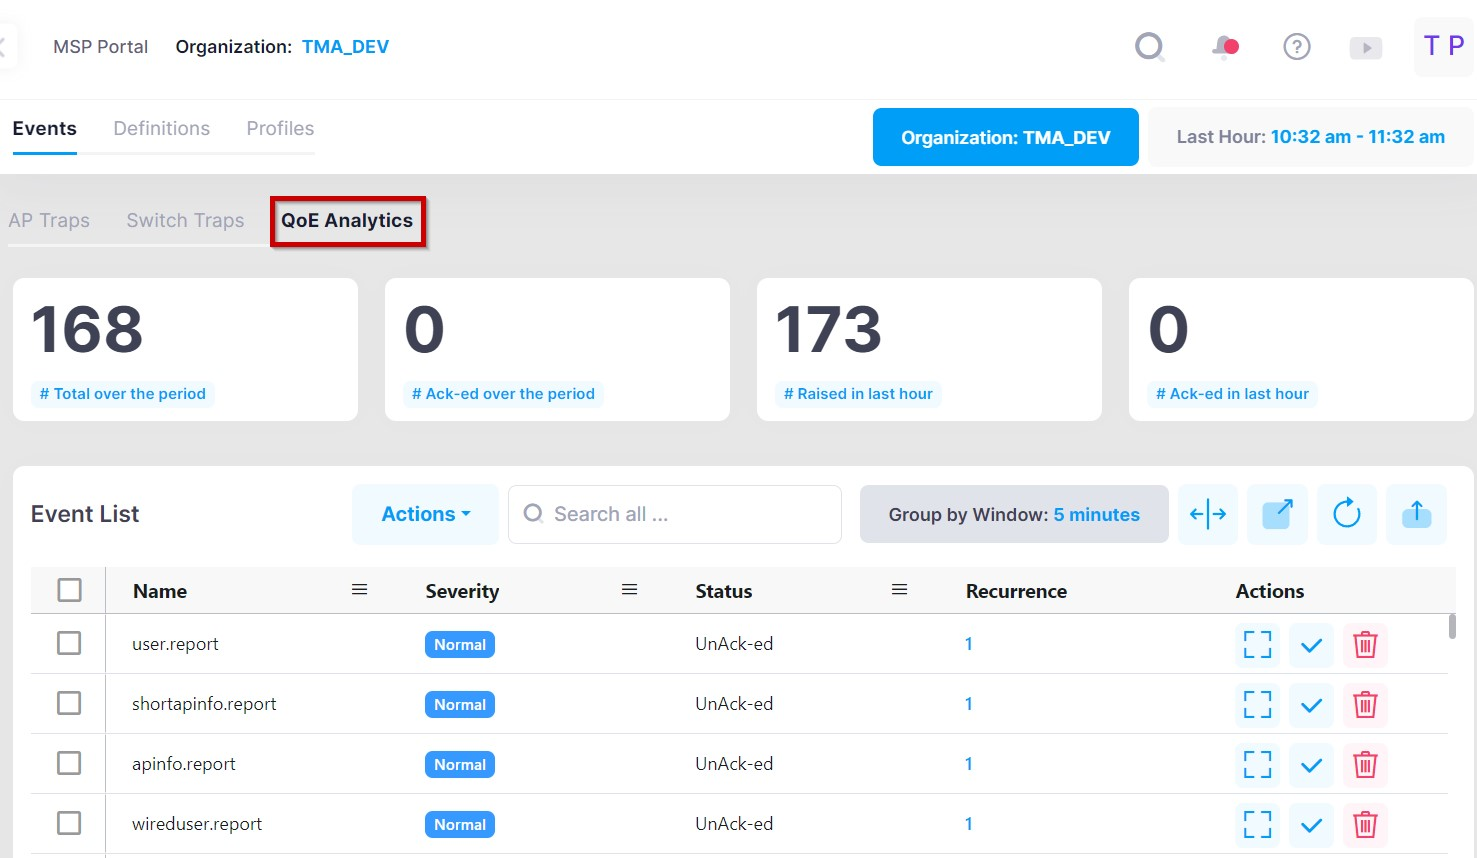
The top section of the QoE Analytics screen provides a summary of QoE Analytics activity during the specified time range based on type of Events. The bottom section of the screen is the Events List, which displays the events received within the specified time range.
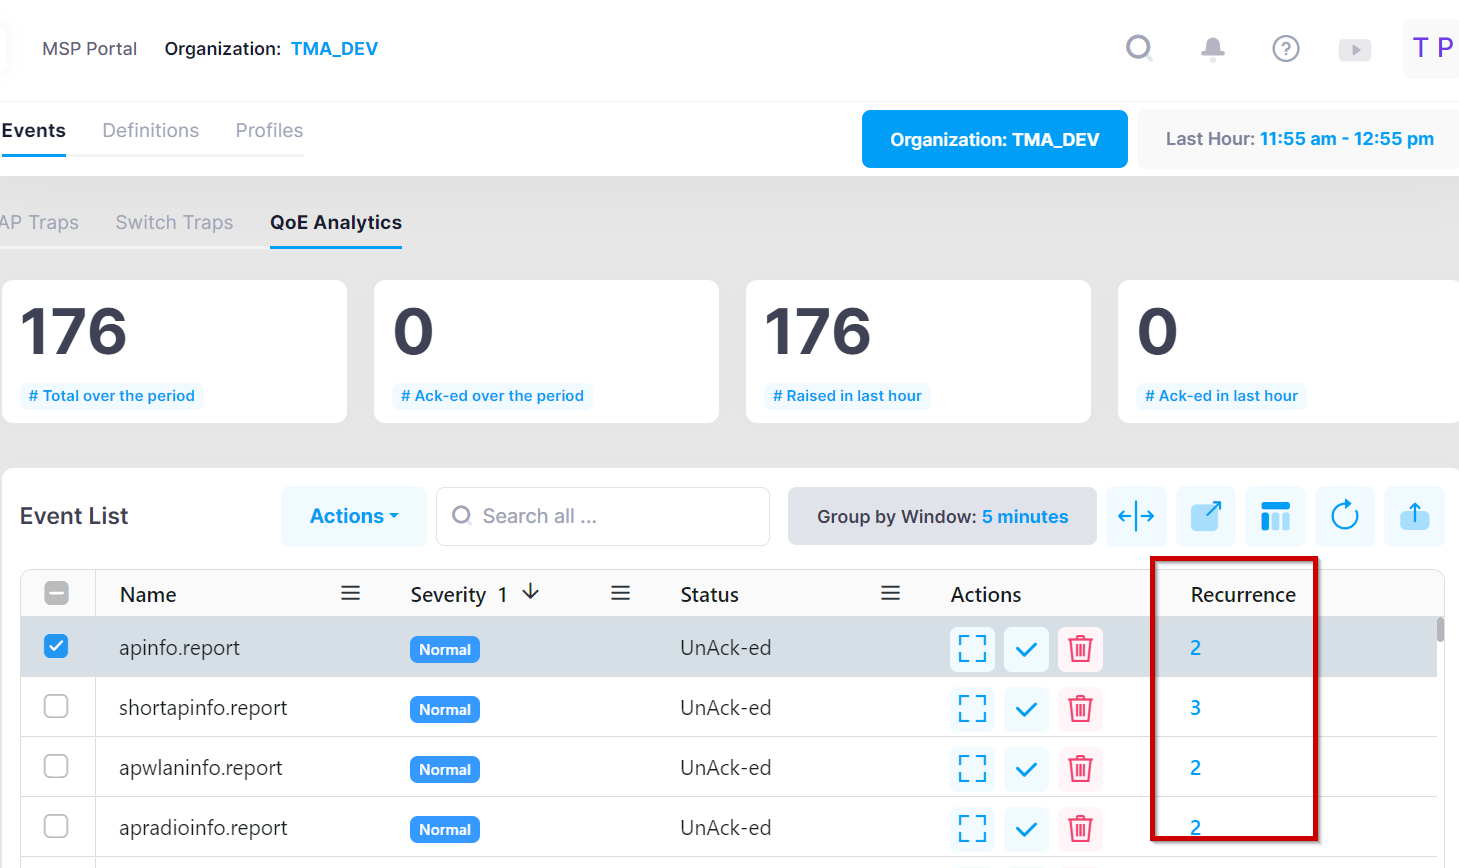
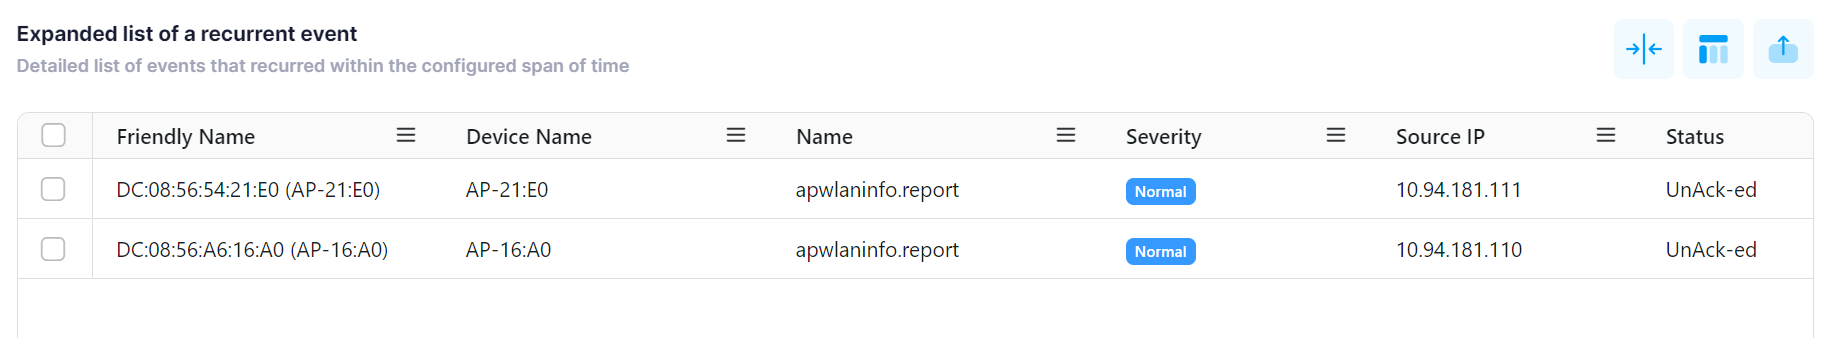
If you want to view the all the occurrences for the Events, then click on the Recurrence column and it will redirect you to the detailed list of events that recurred within the configured span of time as shown below.
Note: For QoE Analytics Events, the maximum time period that can be selected in date filter to view Event Notifications is 24 hours.
Switch Traps - The Switch Traps are the notification events from the switches To access the Switch Traps screen, go to Network Events > Events and click on Switch Traps as shown below.
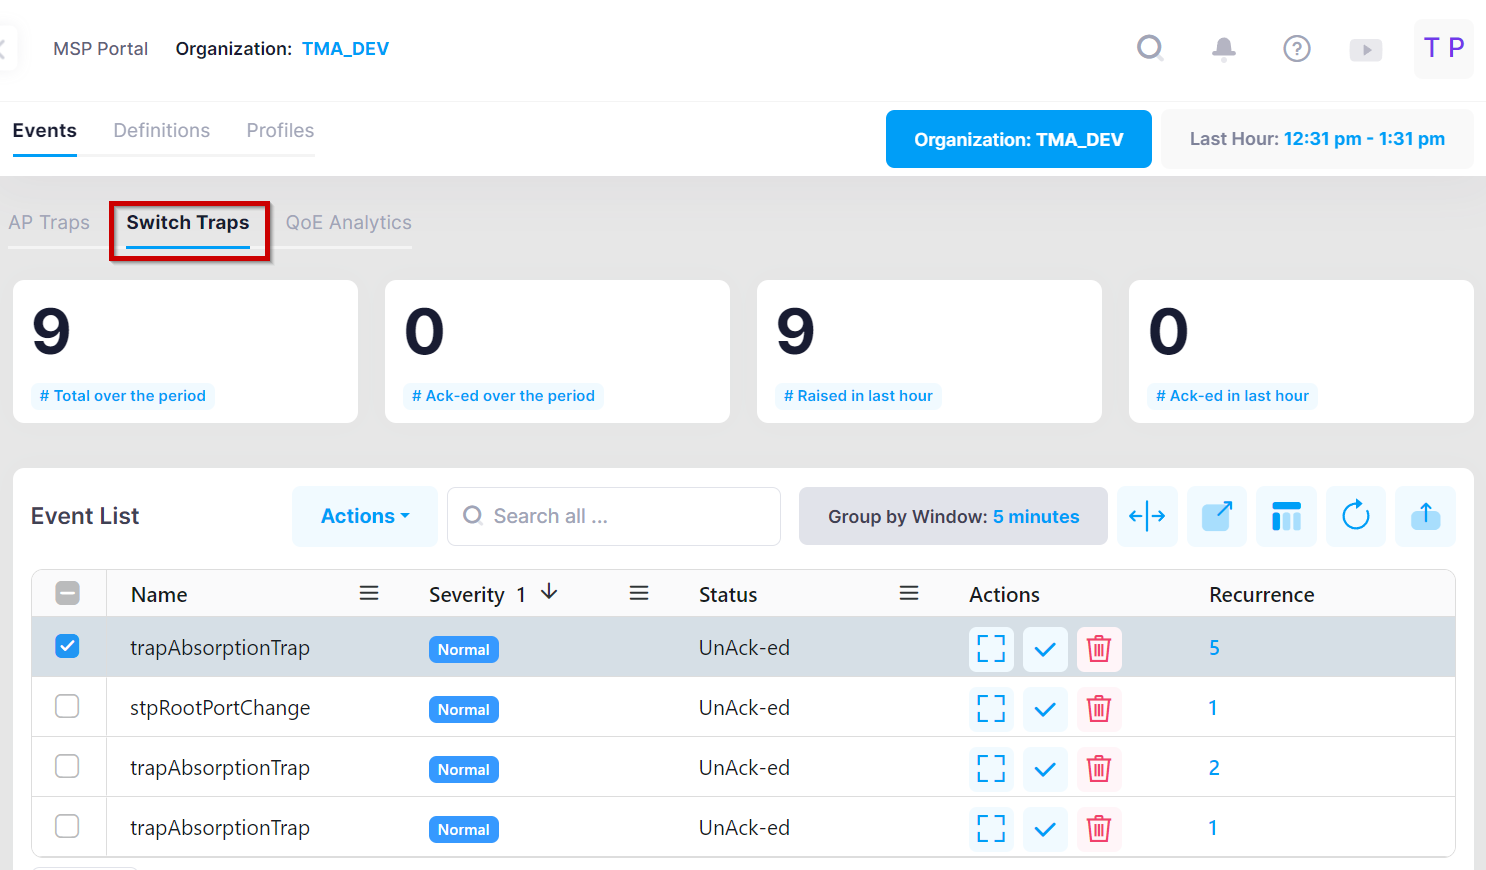
The top section of the Switch Traps screen provides a summary of Traps activity during the specified time range based on type of Events. The bottom section of the screen is the Events List, which displays the events received within the specified time range.
Group by Window
The Group by Window display option allows you to select a range of time during which each type of event received is counted. To select the time range for the Group by Window, click on Group by Window and select from 5 minutes (the default) up to 24 hours from the drop-down menu.
The total number of a specific event type received within the Group by Window range is used to calculate the value reported in the “Recurrence” field. For example, if the Group by Window range is set to 24 hours and the Recurrence number for alert type “Port Auth Failure” is 12, then a “Port Auth Failure” alert was received 12 times during the 24-hour Group by Window range.
If you select the “None” option from the Group by Window drop-down menu, then it displays the detail view of the Event List without any grouping of time range as shown below:
Acknowledging Events
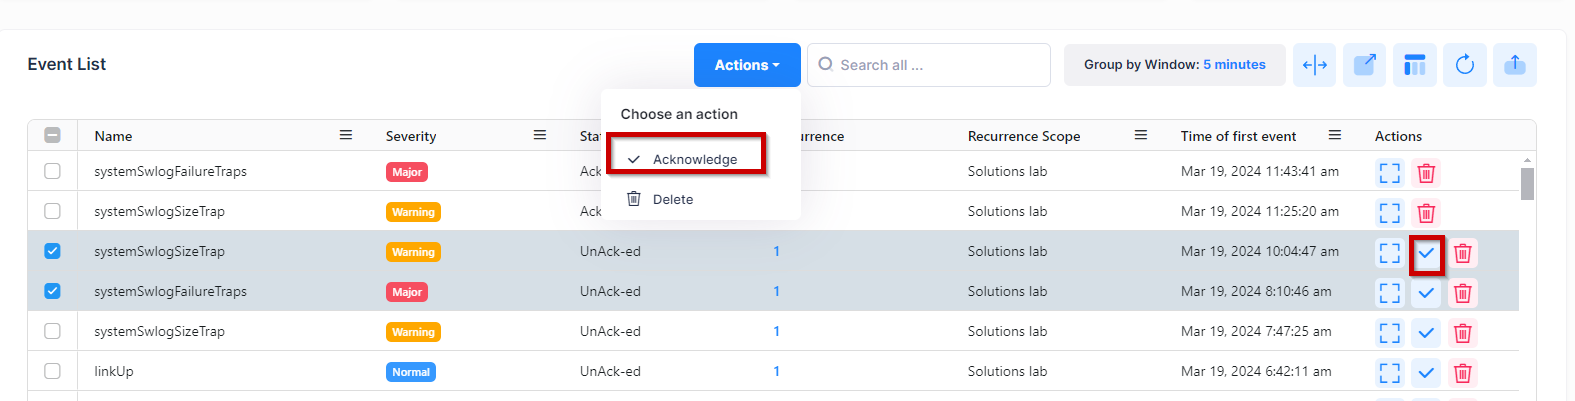
To acknowledge specific events, select one or more events, then select Acknowledge from the drop-down “Actions” menu or click on the checkmark next to the event under the “Actions” column.
To quickly acknowledge all events, select Acknowledge All from the “Actions” drop-down menu. Note that this option is available only when there are no specific events selected within the list.
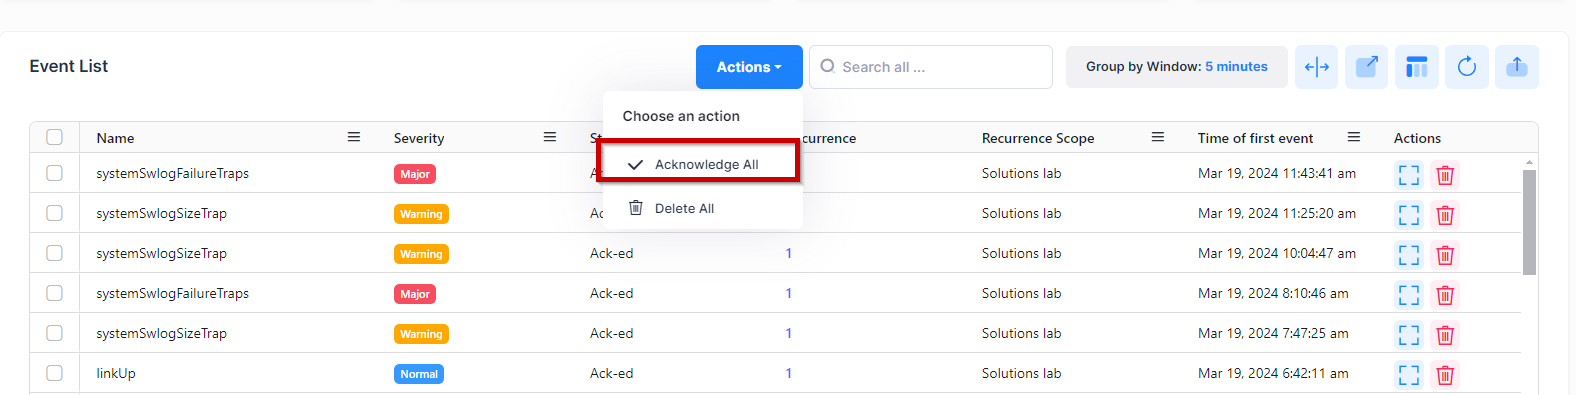
After you acknowledge an event(s), the status for the event(s) changes to Ack-ed.
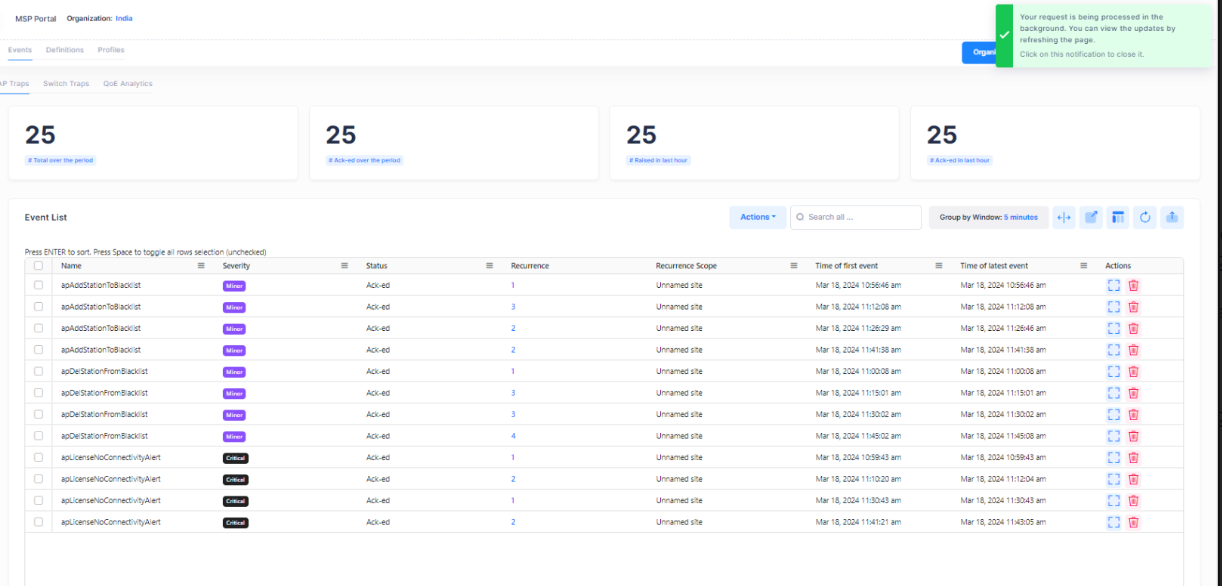
Note: During acknowledge all events, the acknowledge events operation is done in the background. You can view the updated results by clicking on the refresh button at certain time intervals as shown below.
Deleting Events
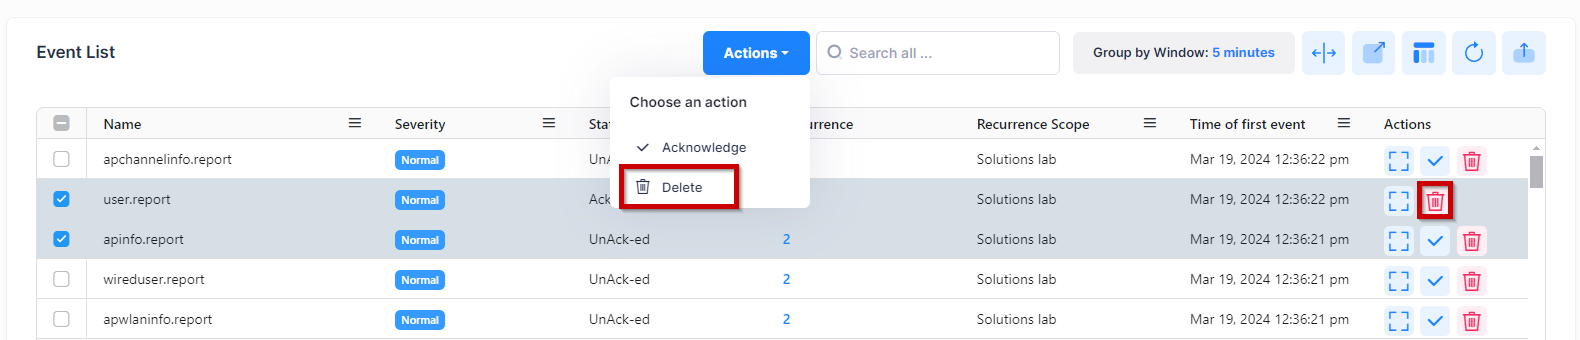
To clear specific events from the Events List, select one or more events, then select Delete from the “Actions” drop-down menu or click on the Delete icon next to the event under the “Actions” column.
To clear all events from the Events List, select Delete All from the “Actions” drop-down menu. Note that this option is available only when there are no specific events selected within the list.
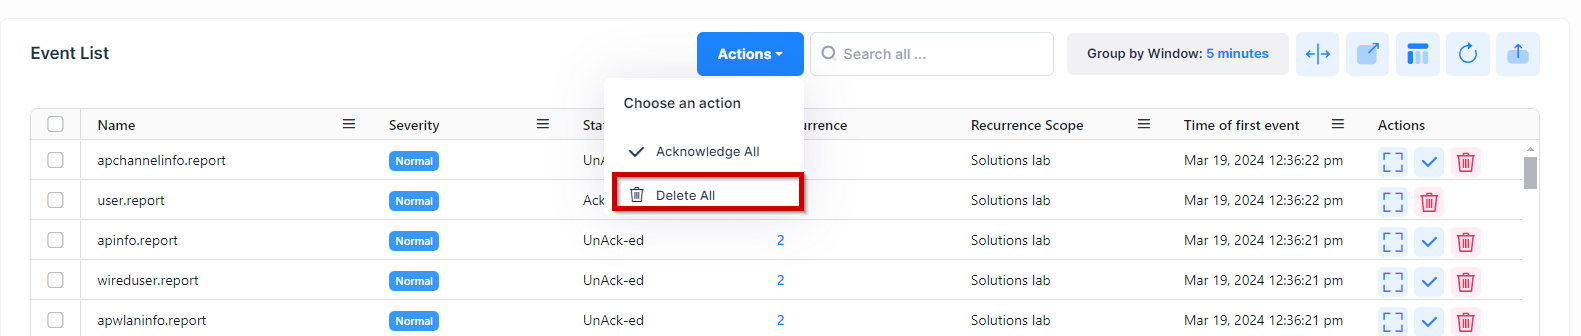
Note: During delete all events, the delete events operation is done in the background. You can view the updated results by clicking on the refresh button at certain time intervals.
Export Events
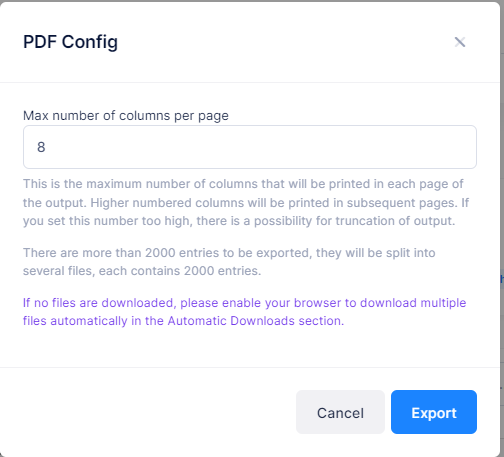
To export multiple Events from an existing List, click on the Export button and select one of the available options to export the data in an Excel, CSV or PDF file format as shown below.
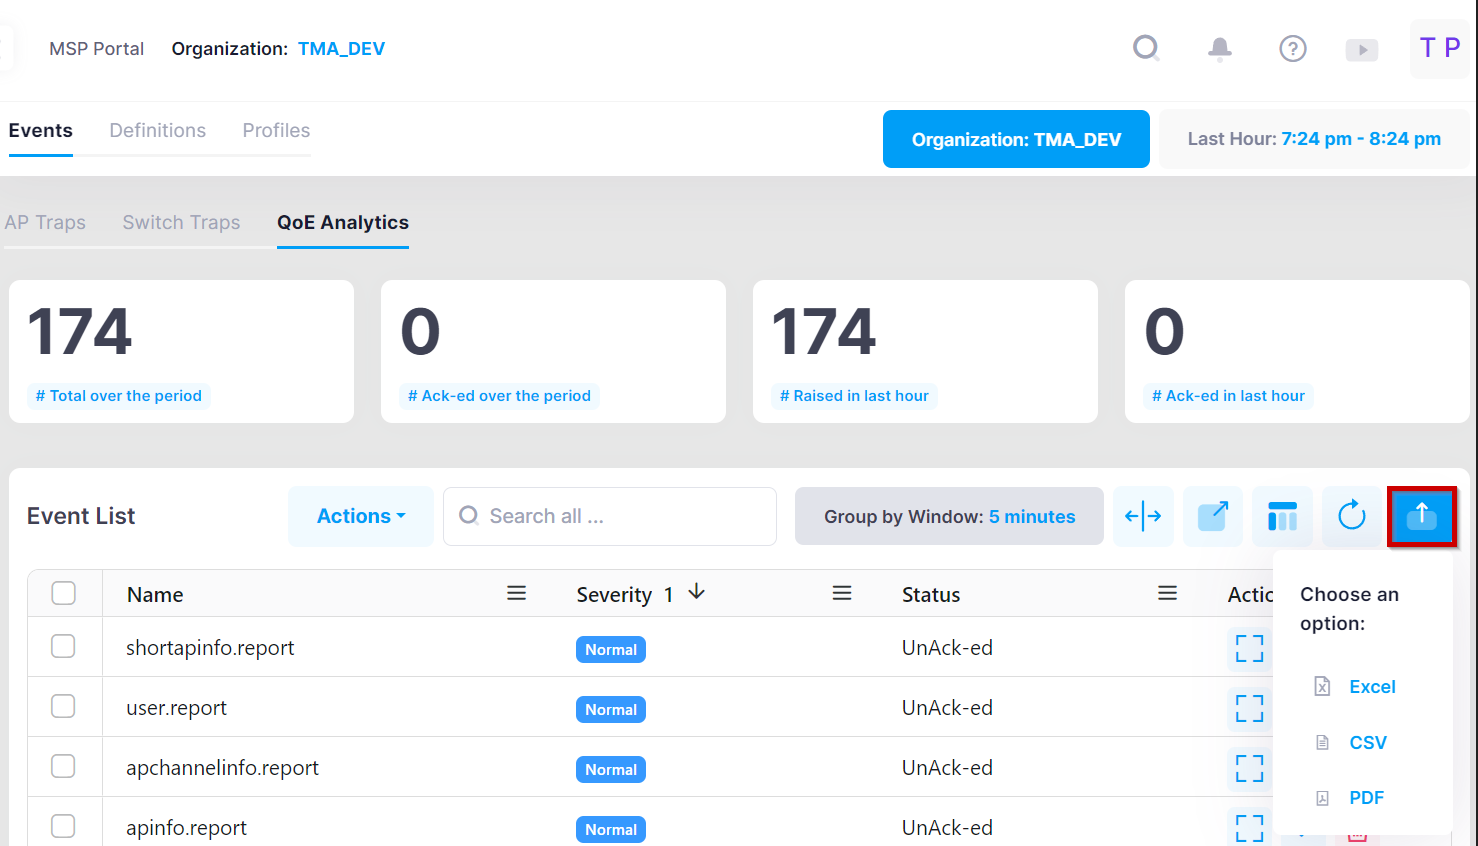
You will then be prompted to a dialog box that displays the notification that if there are more than 2000 entries to be exported, then the data will be split into multiple files, each containing 2000 entries. Also, there is a limitation on the browser level to export only the latest 15,000 data entries for a chosen scope and time.