
To manage the catalog of Advisor Edge Anomaly definitions, navigate to Configure > Advisor Edge > Anomalies. The List of Anomalies screen appears with the list of anomaly definitions monitored by the Advisor Edge instance.
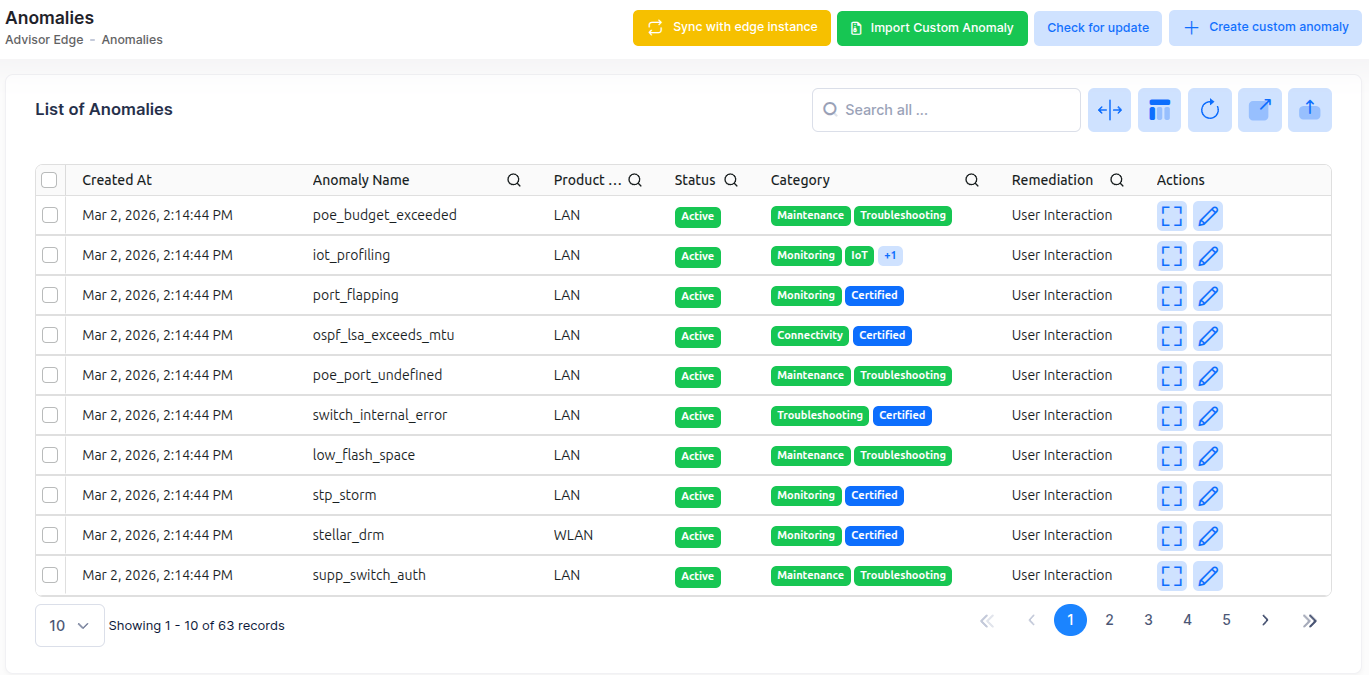
The following information is provided for each anomaly definition:
-
Friendly Name - The human-readable name of the anomaly.
-
Product Line - The product line the anomaly applies to: LAN or WLAN.
-
Status - Whether monitoring is On (active) or Off (inactive). When inactive, the network is not monitored for this anomaly.
-
Severity - The severity level of the alert sent to Rainbow: High or Low.
-
Category - Tags assigned to the anomaly. There are two types:
-
Categorization labels: user-defined tags for grouping anomalies (for example, "Troubleshooting").
-
Type labels: Certified (ALE-certified anomaly), Custom (user-defined anomaly), Support (used by technical support).
-
-
Remediation - The corrective action taken when the anomaly is detected:
-
User Interaction: the user receives a Rainbow alert with action buttons to resolve the issue manually.
-
Automated: the recommended remediation action is applied automatically without user notification.
-
Advanced: the action previously chosen by the user for this specific context is remembered and applied automatically on recurrence.
-
-
Version - The version of the anomaly definition.
You can perform the following actions from the List of Anomalies screen:
-
Sync with Edge Instance - Synchronize the official anomaly catalog with your Advisor Edge instance.
-
Check for Updates - Check for new or updated anomaly definitions.
-
Managing Anomalies - View, filter, search, and edit anomaly definitions
-
Configuring Custom Anomalies - Import, create, edit, and delete custom anomalies specific to your organization.
To analyze the history of detected anomalies, see the Monitoring Anomalies online help.
Check for Anomaly Updates
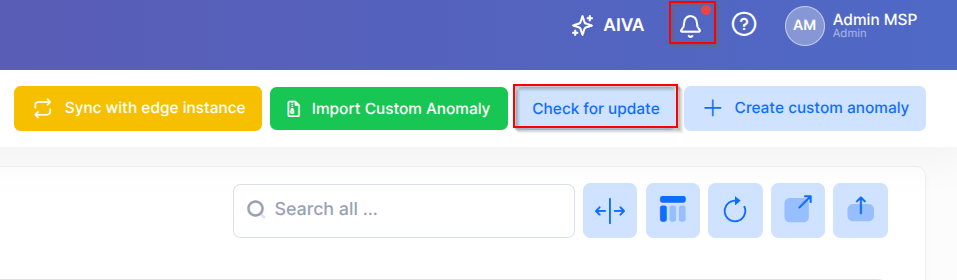
To check for new or updated anomaly definitions, click on Check for update on the top action bar. If a newer anomaly definitions package is available, a notification badge appears on the bell icon in the top bar, as shown below.
To view the available anomaly definitions update, click on the Bell icon to open the Notifications panel, then click on Updates.
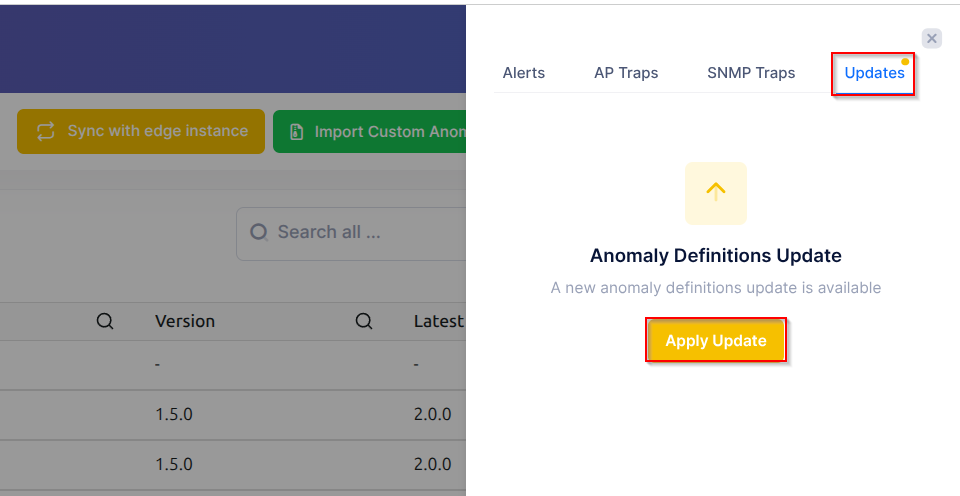
Click Apply Update to start the update process. Wait until the operation completes, then refresh the anomaly list if needed to confirm updated definition versions. If no update is available, no apply action is required and you can continue managing anomalies normally.
Managing Anomalies
Use the List of Anomalies screen to view, filter, and search anomaly definitions. In addition, you can change the status or severity of an anomaly and edit anomaly details.
To filter the anomaly list:
Click the filter icon on any column header. A dropdown appears allowing you to select a fixed value or enter a search term to narrow the displayed anomalies. You can also use the Search Bar at the top of the screen to search by anomaly name.
To change the status or severity of an anomaly:
-
Select an anomaly from the list and click Actions.
-
From the dropdown menu, choose one of the following:
-
Switch to Active status - Sets the anomaly monitoring to On.
-
Switch to Inactive status - Sets the anomaly monitoring to Off.
-
Mark as High Severity - Changes the severity to High.
-
Mark as Low Severity - Changes the severity to Low.
-
To edit anomaly details:
-
Click the Edit icon for the anomaly you want to modify.
-
The Edit Anomaly screen opens with the following configurable fields:
-
Severity - Change the severity level (High or Low)
-
Status - Enable or disable monitoring for this anomaly
-
Remediation mode - Change the remediation behavior (User Interaction, Automated, or Advanced)
-
-
Click Submit to apply your changes.
For Certified and Support anomalies, the name and description fields are read-only; you can still add custom labels. For Custom (user-defined) anomalies, the name and description are also read-only after the anomaly is created.
Creating Custom Anomalies
You can create one or more custom anomaly definitions by importing a custom anomaly or creating a new one.
To import a custom anomaly:
Click Import Custom Anomaly at the top of the Anomalies screen.
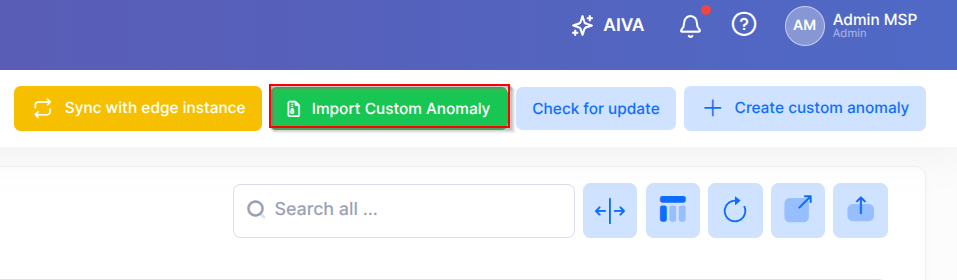
Select the custom anomaly file to import from your system. The imported anomaly appears in the anomaly list with the Custom label.
To create a custom anomaly:
Click Create a Custom Anomaly at the top of the Anomalies screen.
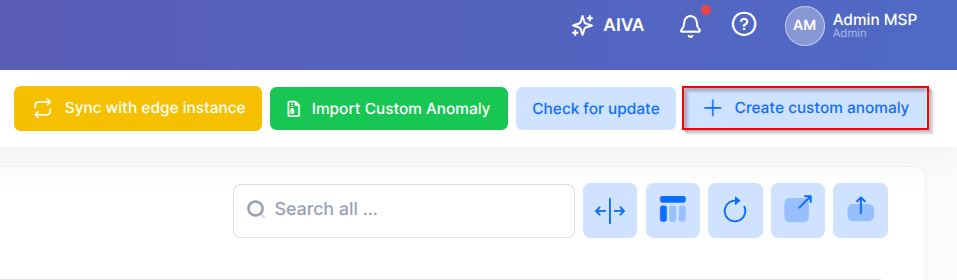
The following New Custom Anomaly form appears:
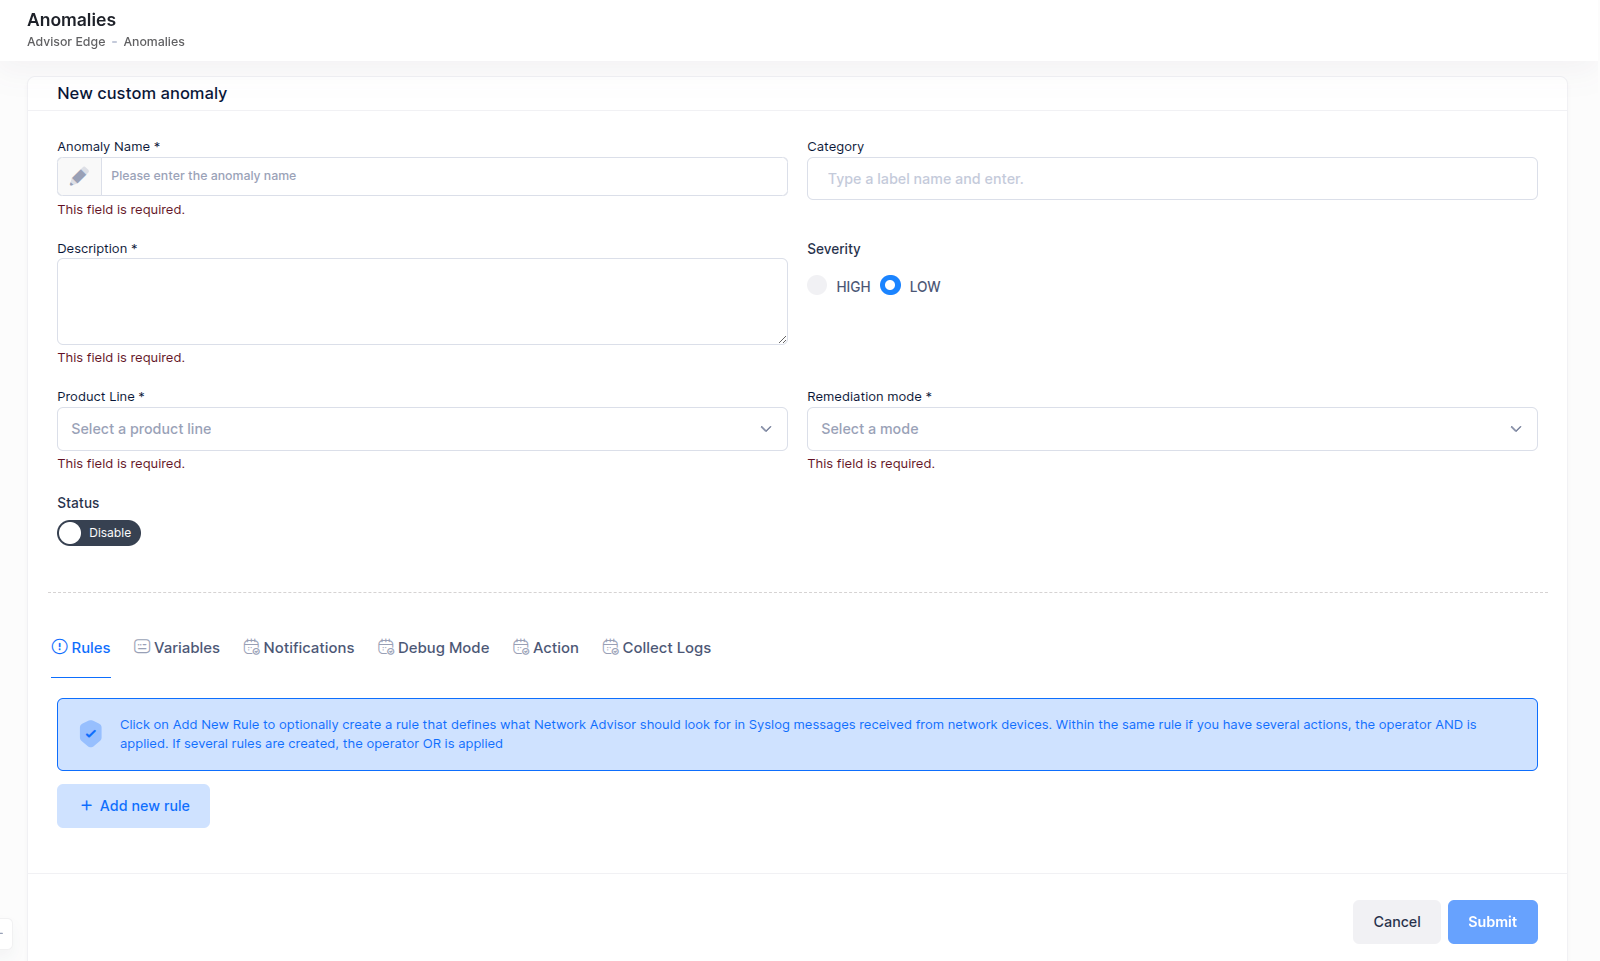
Complete the fields as described below:
-
Anomaly Name - The name to assign to the custom anomaly.
-
Description - A description of what the anomaly monitors.
-
Product Line - The product line the anomaly applies to: LAN or WLAN.
-
Category - Select one or more labels to categorize the anomaly (the Custom label is selected by default).
-
Severity - Set the alert severity level: High or Low.
-
Status - Enable/disable the custom anomaly status.
-
Remediation - Select the corrective action: User Interaction, Automated, or Advanced.
-
Rules - Click Add new rule to optionally create a rule that defines what Advisor Edge should look for in Syslog messages received from network devices. Multiple actions within the same rule are combined with an AND operator. If several rules are created, the operator OR is applied.
-
Variables - Variables are used to extract information from the log sent by the device. This will help to have a custom description of the anomaly or to create custom actions. Input your Regex Pattern and you can name the variable found in the pattern. For example: a Regex Pattern of "router (\w+)\s(\d+.\d+.\d+.\d+) is (DOWN|UP) for (\d+) minutes" will detect four variables corresponding to the router name, IP address, status, and duration from the syslog message "router my_router 172.16.0.1 is DOWN for 5 minutes".
-
Notifications - The text defined in this field is displayed in the Adaptive Card when the anomaly is triggered. You can use variables defined in tab Variables by typing ${variable} (ex: ${memory_usage} ).
-
Debug Mode - Enable/disable Debug Mode. When enabled, this option sets the log level to DEBUG to collect more information. Debug mode is only available for switches.
-
+Add increase log level command - Click on this option to set your desired App with the desired log level. For example, “swlog appid %s subapp %s level %s”.
-
+Add decrease log level command - Click to turn log level back to the default after remediation. For example, “swlog appid %s subapp %s level info”.
-
-
Action - Click on +Add New Action to optionally create an action that will execute on the device using SSH.
-
Collect Logs - Enable/disable log collection. When enabled, this option collects logs on the device that you can retrieve directly through Rainbow. You can chose to collect logs before or after the specified action step.
When you are finished defining the Custom Anomaly, click Submit. The new Custom Anomaly appears in the anomaly list with the Custom label.
Remediation scenarios for custom anomalies:
Depending on the remediation mode and configuration, the following response scenarios are available:
|
Scenario |
Description |
|---|---|
|
Notify Only |
A low-priority event is received — a notification is sent to the user via Rainbow |
|
Notify + Action |
A critical event occurs — a Rainbow notification is sent and an action is performed (e.g., shut down a port, apply QoS) |
|
Notify + Collect Log |
An event requires investigation — a Rainbow notification is sent and additional logs are collected from the device |
|
Notify + Action + Collect Log |
A critical event requires both immediate action and investigation — notification, action, and log collection are all triggered |
|
Notify + Debug + Action + Collect Log |
A critical event requiring detailed response — advanced debug logging, notification, action, and log collection |
Deleting a Custom Anomaly:
Locate the Custom Anomaly in the List of Anomalies (identified by the “Custom” label) and click on the Delete icon for the anomaly under the “Actions” column. When prompted, click Delete to confirm removing the Custom Anomaly.
You can only delete Custom (user-defined) Anomalies. Certified and Support anomalies are permanent and cannot be removed.