Fleet Supervision can generate alerts based on the network device events and user configuration failure within the specified time range. The Alerts screen provides a list of alerts received and basic alert information (for example, event/cause, date/time received).
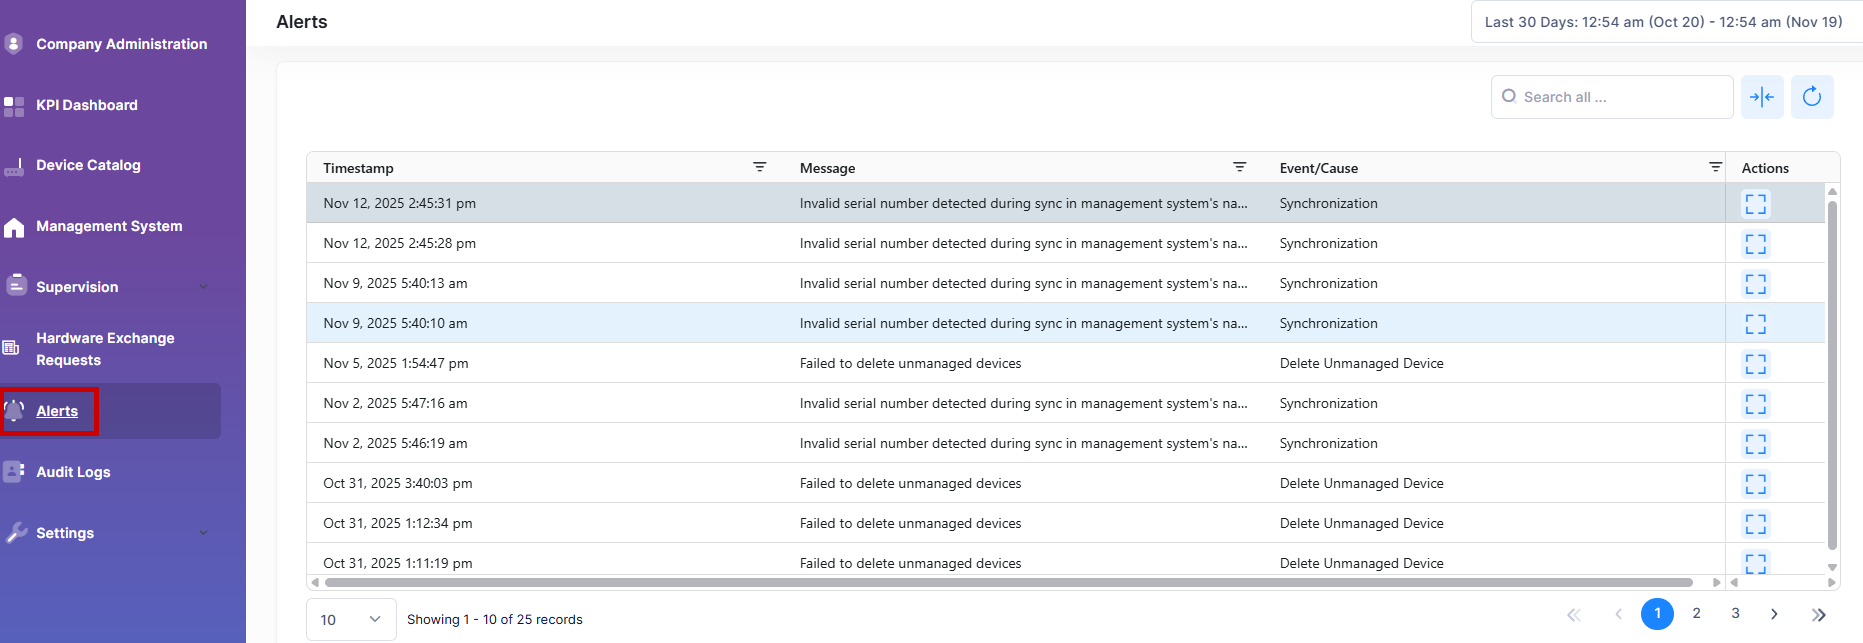
The Alerts List provides the following information for each alert received:
-
Message - The reason or description of the generated alert. The name varies by issue type detected.
-
Timestamp - The date and time the alert was initially received.
-
Event/Cause - The specific alert generated based on which events (source) or which cause.
Viewing the Alerts List
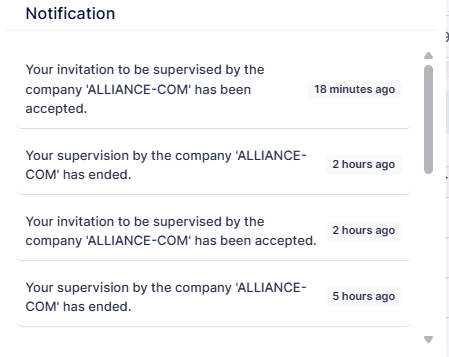
All Alerts from all devices within the Fleet account scope and specified timeframe are displayed and updated in real-time. New Alerts received are also indicated when a red blinking dot appears to the top of the bell icon. The bell icon provides a list of recent 10 new Alerts received. For example:
Display Additional Alerts Information
If you want to see a list of alert entries detail page, click on Additional Information on “Actions” column next to a list entry to display detailed information for a specific Alert Entry.
The following screen will appears:
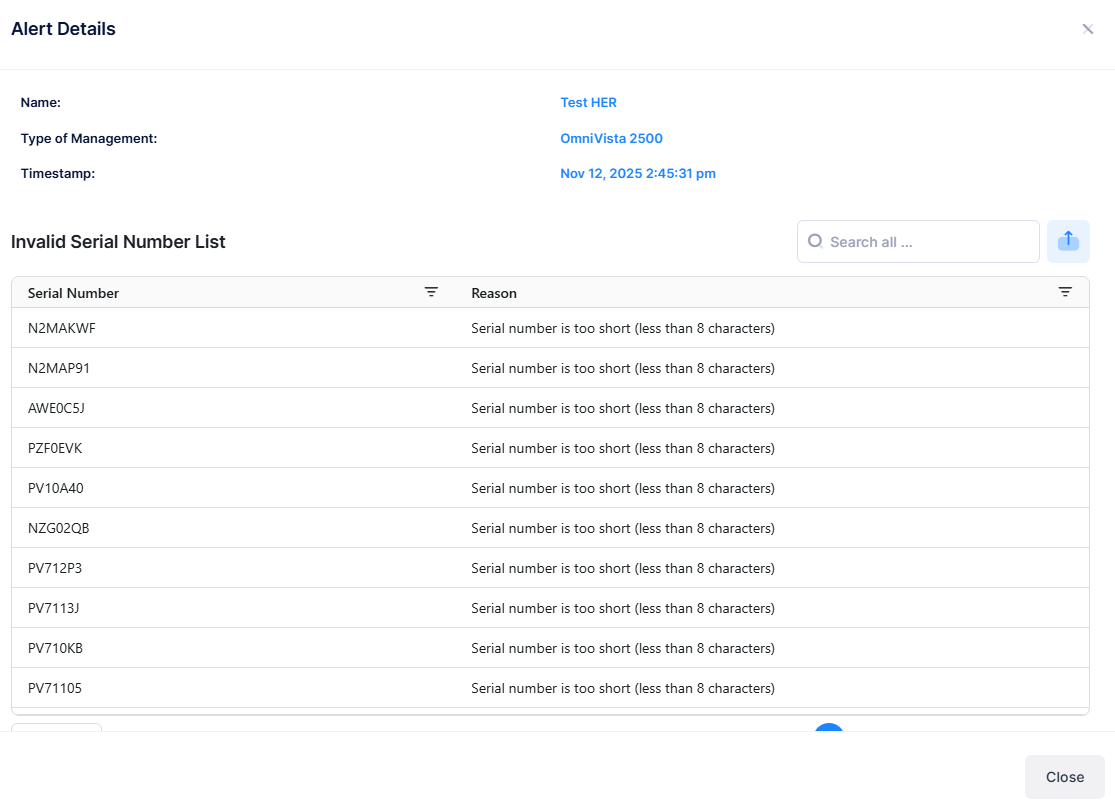
The following information for each alert received:
-
Name - The name assigned to the alert.
-
Type of Management - Select OmniVista 2500, OmniVista Cirrus 10 or OmniVista Cirrus 4.
-
Timestamp - The date and time on which the alert was initially received.
-
Serial number - The invalid serial number of the device.
-
Reason - The reason for the Alert.