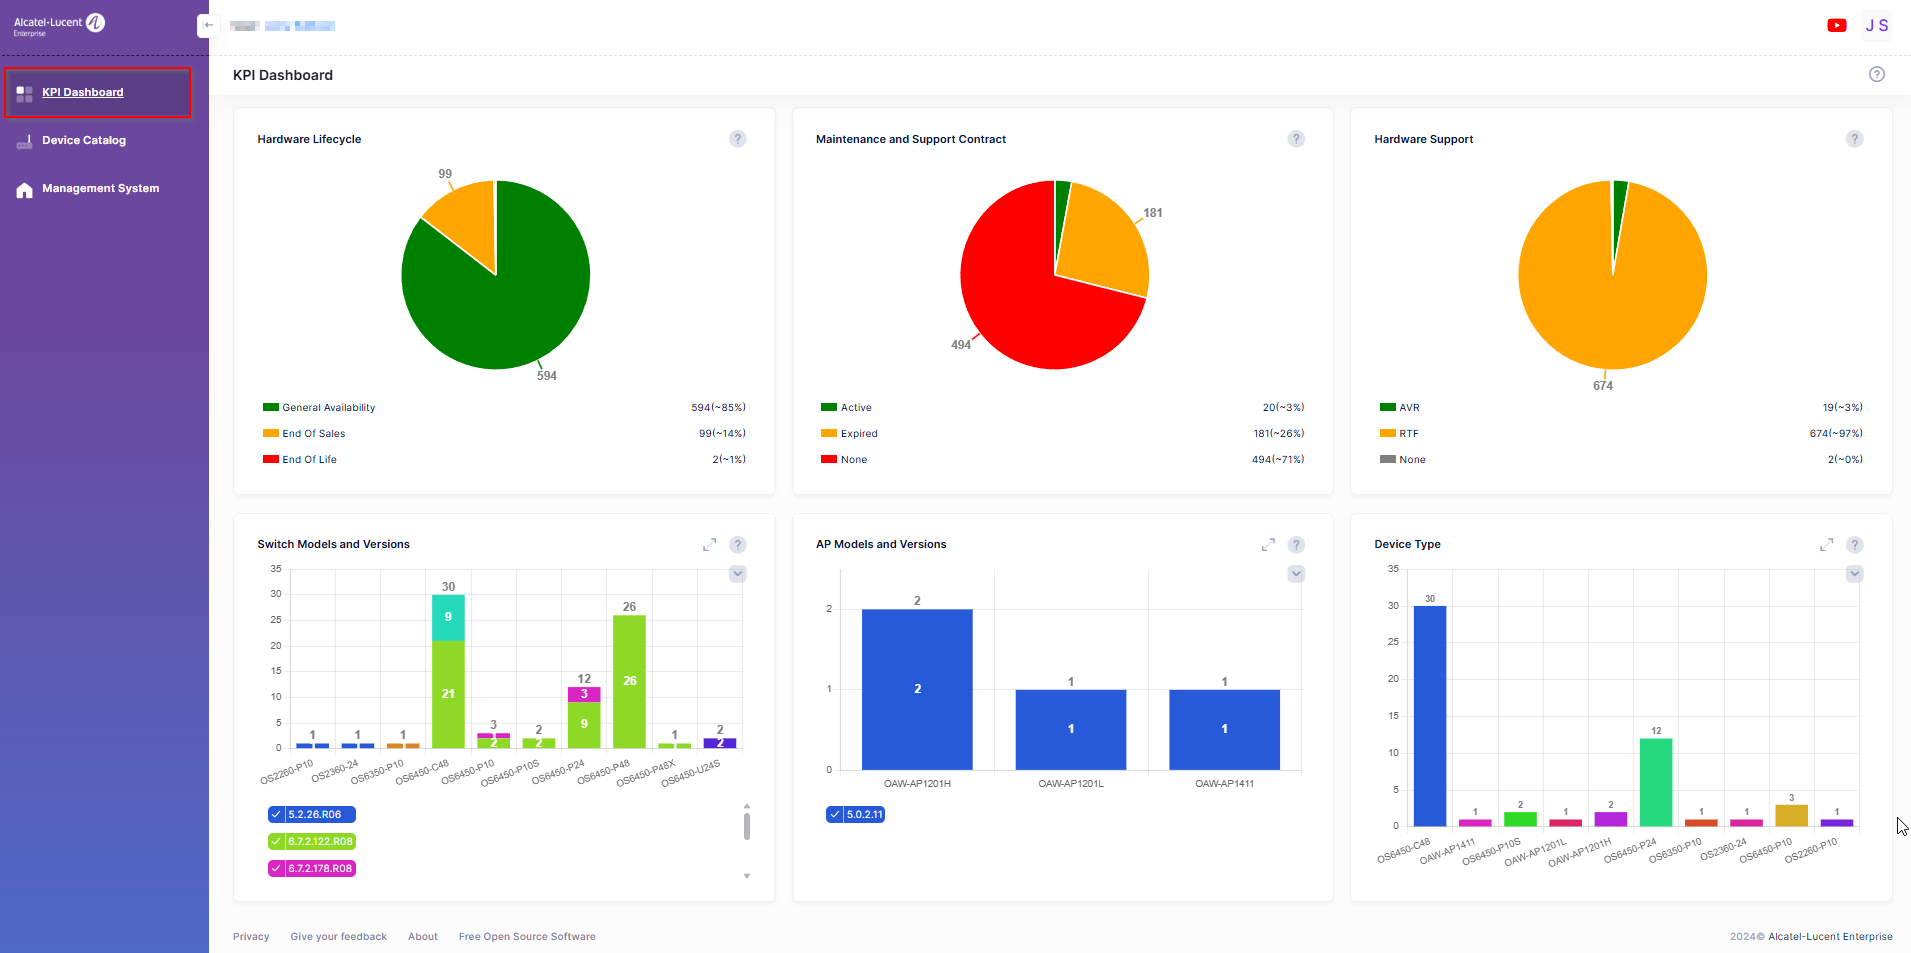
The KPI Dashboard includes a series of charts that provide a quick overview of devices in your network. Each chart widget provides basic information at a glance (for example, the Hardware and Software Support widgets show the number of network devices supported/not supported).
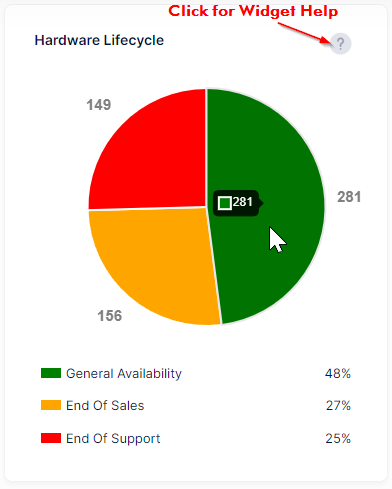
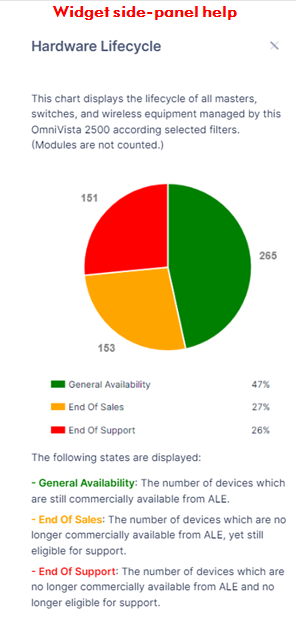
Click on the “?” (question mark) at the top-right corner of each Widget to display details about the Widget information. For example, when you click on the “?” mark for the Hardware Lifecycle widget, a side-panel opens with specific information about the widget, as shown below. Click on an area of the chart to bring up a list of the underlying devices.
The KPI Dashboard provides the following charts: