The QoE Dashboard is used to examine the overall QoE metric values for a specific set of Devices defined in a selected scope (for example, entire Organization, Sites, Buildings, Floors, or Access Points).
The Network Analytics Summary at the top of the dashboard displays the total number of Access Points, Access Points Up, Down Count, number of Live Wireless and Wired Clients, total number of Switches, Switch Up and Switch Down Count in the Network.
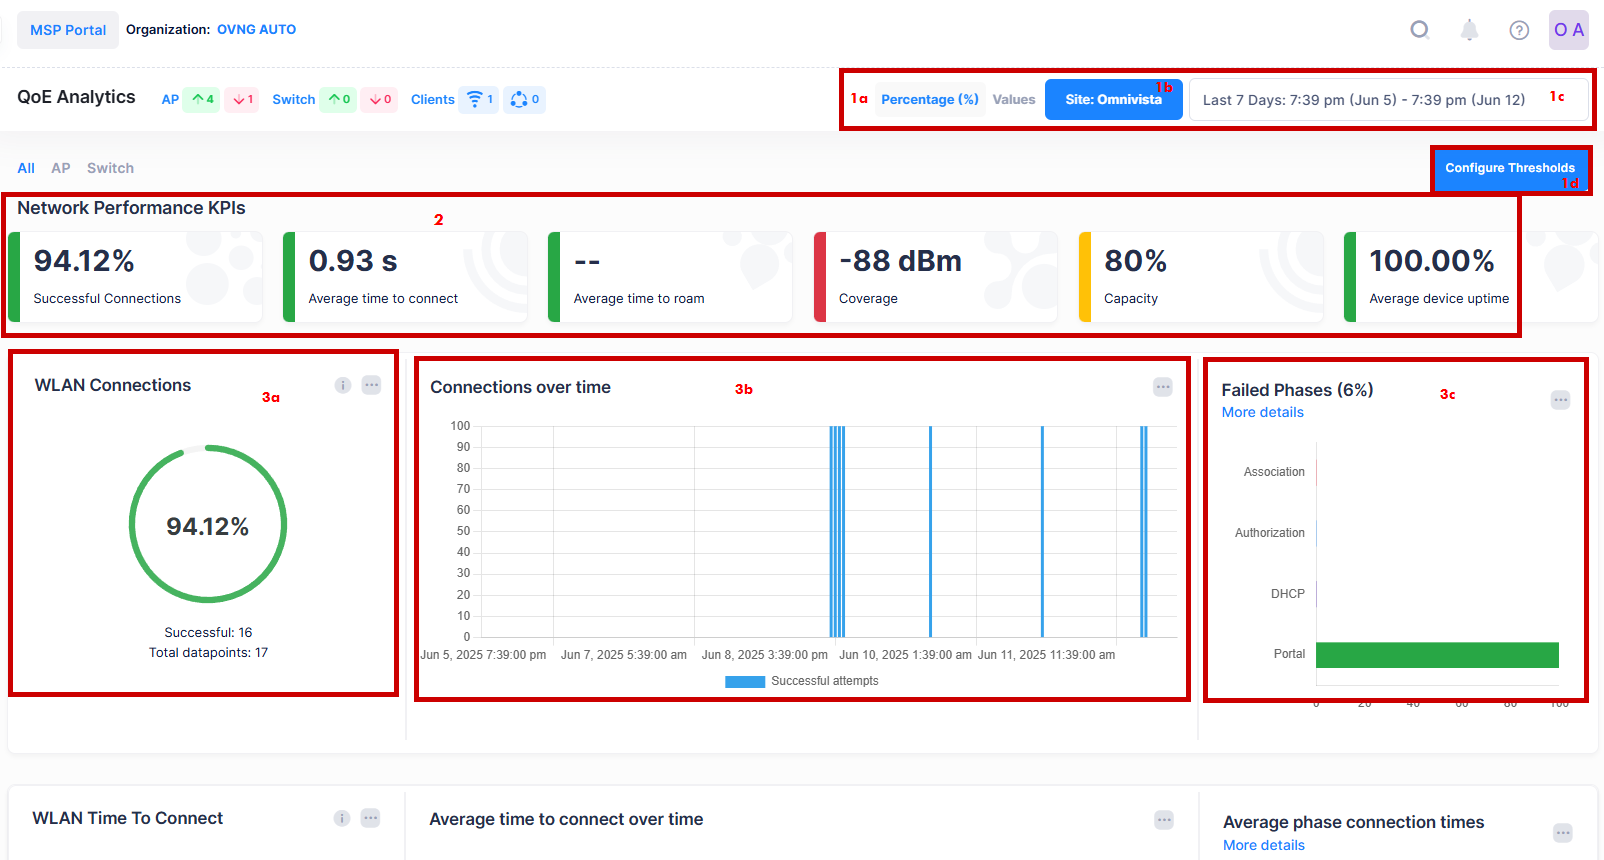
The QoE Dashboard is divided into three different sections:
-
The filter and actions section: This section allows you to:
-
Select the format of the data to be displayed: Percentage or Real Values.
-
Select the scope of Devices for which you want to retrieve the QoE attribute values.
-
Select the Time window during which you want to analyze the QoE attribute values.
-
Configure the QoE Thresholds: for certain QoE attributes, you can adjust the threshold to match your expectations.
-
-
The Network performance KPIs section: This section allows you to take a quick look at the overall QoE attributes performance index.
-
The QoE attributes detail section: If you want to go deeper into the analysis of each QoE attribute value, you can scroll down to reach the QoE attribute details view. For each QoE attribute, three elements are available:
-
A large counter widget representing the percentage of success reached for the QoE attribute compared to the threshold (if any).
-
A bar chart widget representing the evolution of the QoE attribute value over time.
-
A Failed Phases bar chart widget representing the categorization of the failures that occurred. (Not counted as a success case).
-
The QoE Dashboard is used to:
QoE metrics data is retained for 30 days.