From the QoE Dashboard page, you may want to further analyze the failures that occurred in one of the tracked QoE metrics.
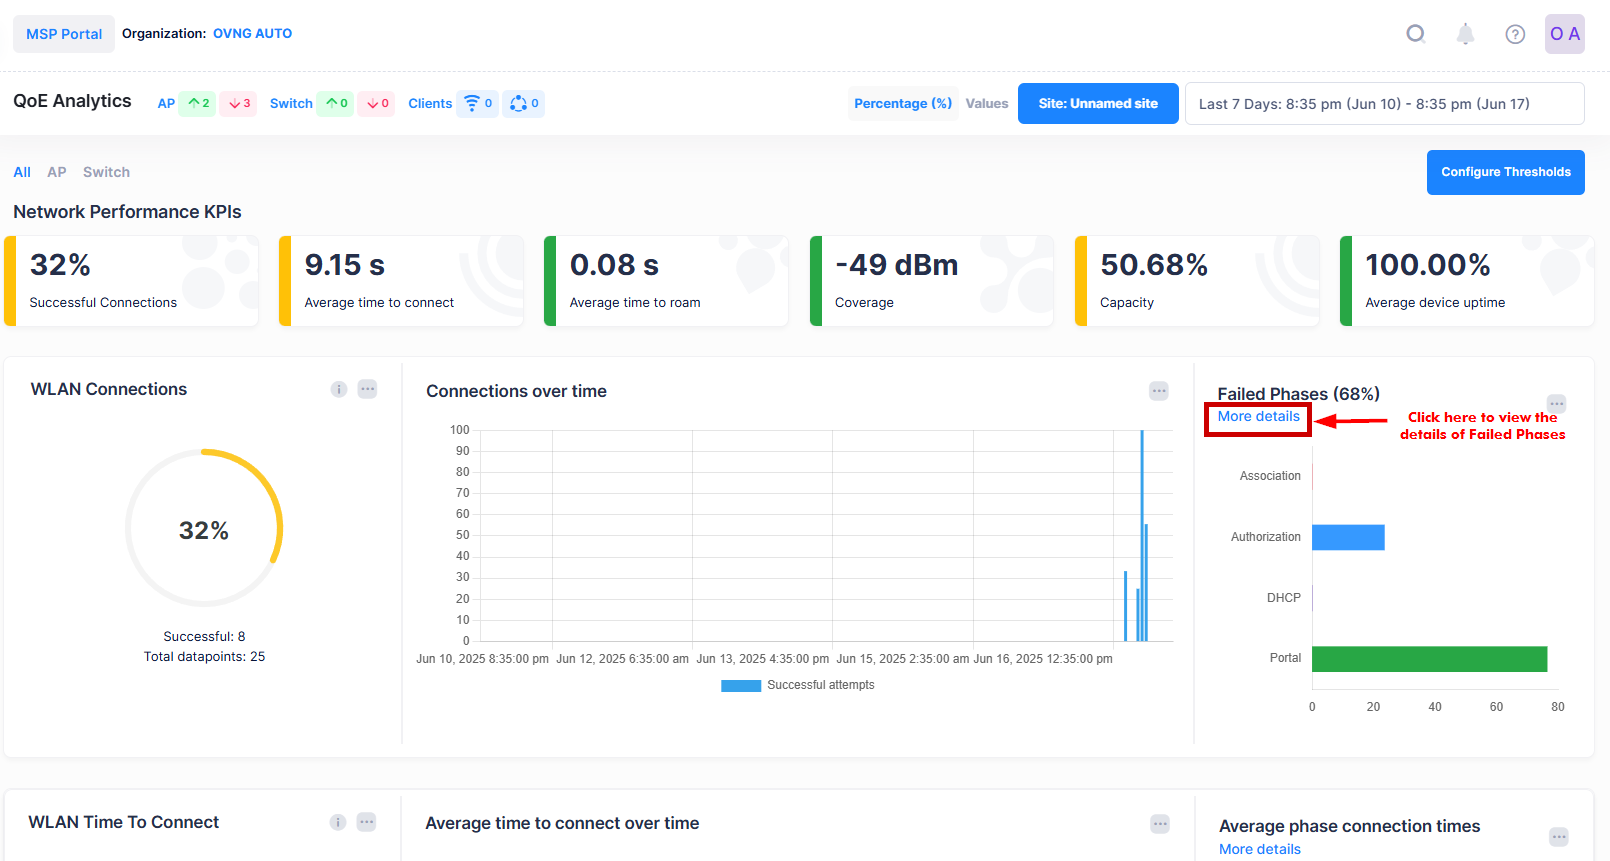
The Network Analytics Summary at the top of the dashboard displays the total number of Access Points, Access Points Up, Down Count, Switch Up, Switch Down Count, number of Live Wireless and Wired Clients connected in the Network.
Click on the More details button in the “Failed Phases” block of the QoE metric for which you want to analyze the failures:
The Failure Classifiers dashboard appears. This page is divided into four parts:
-
The Summary widget - This widget gives a summary of the number of client sessions that experienced a failure in one of the tracked classifiers.
-
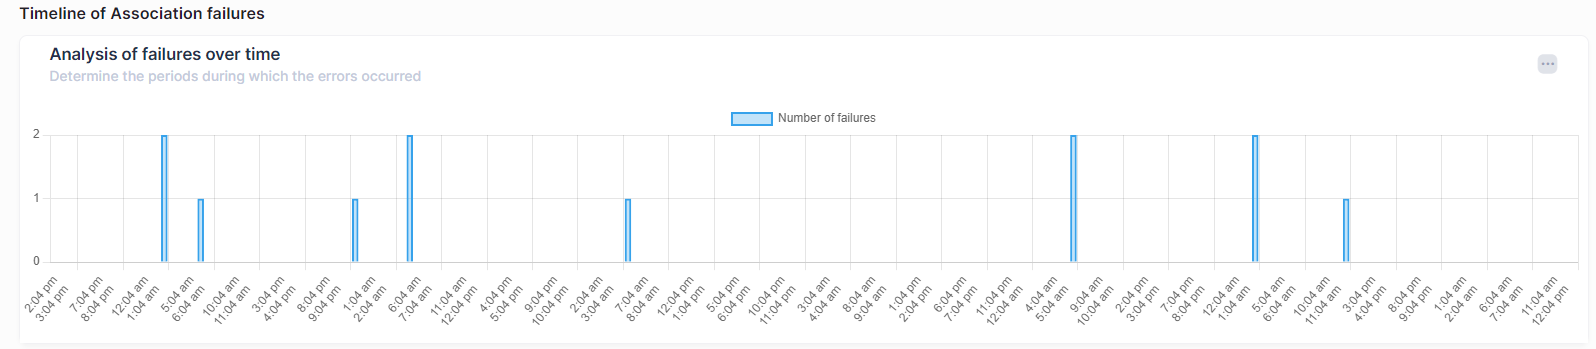
The Timeline of failures - This widget represents a timeline allowing us to know at which timestamp the failures occurred.
-
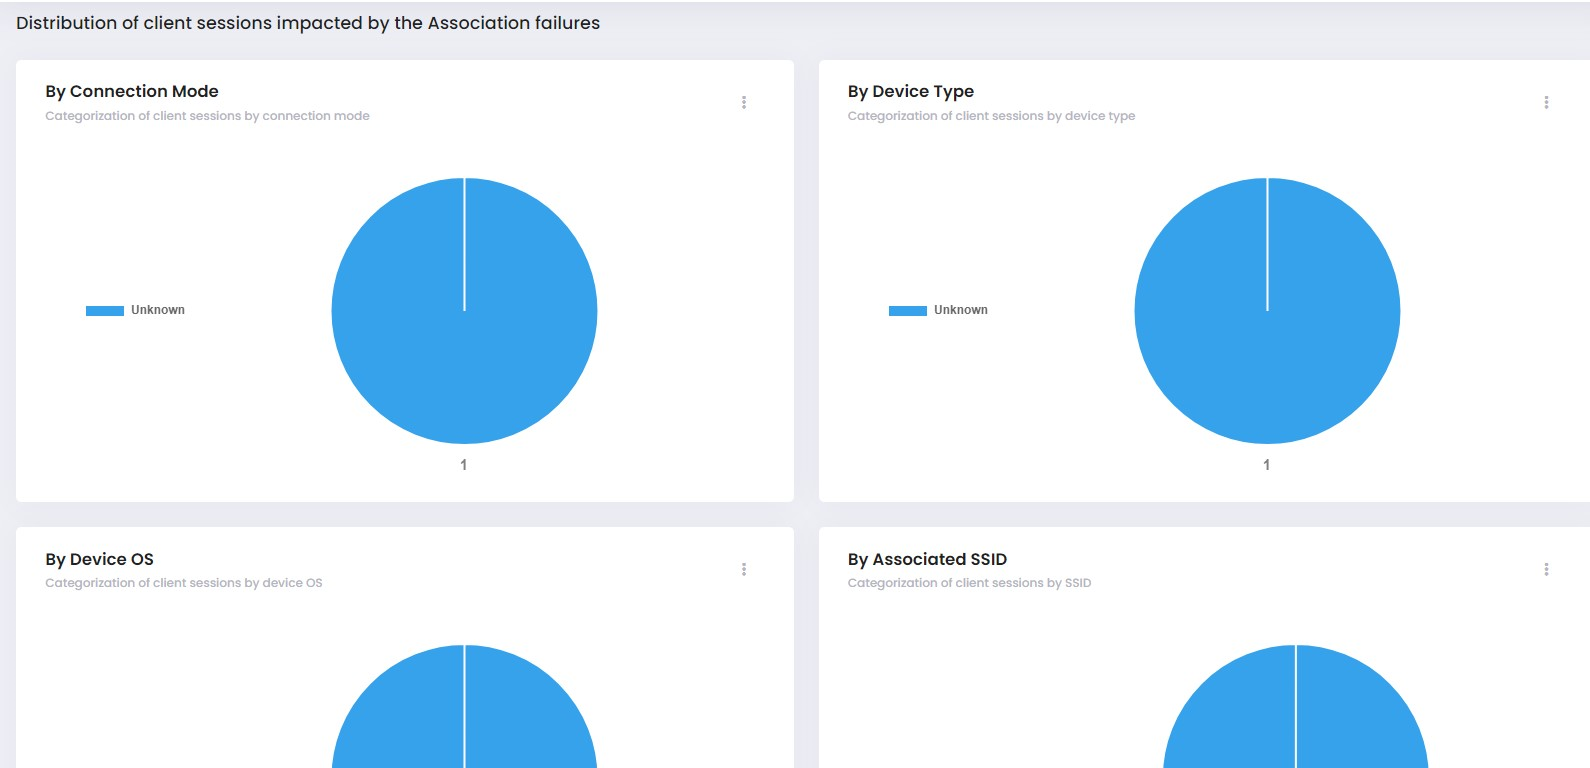
The distribution of client sessions impacted by the selected classifier failures - This section contains pie charts that give the distribution of client sessions impacted by the selected classifier failures.
-
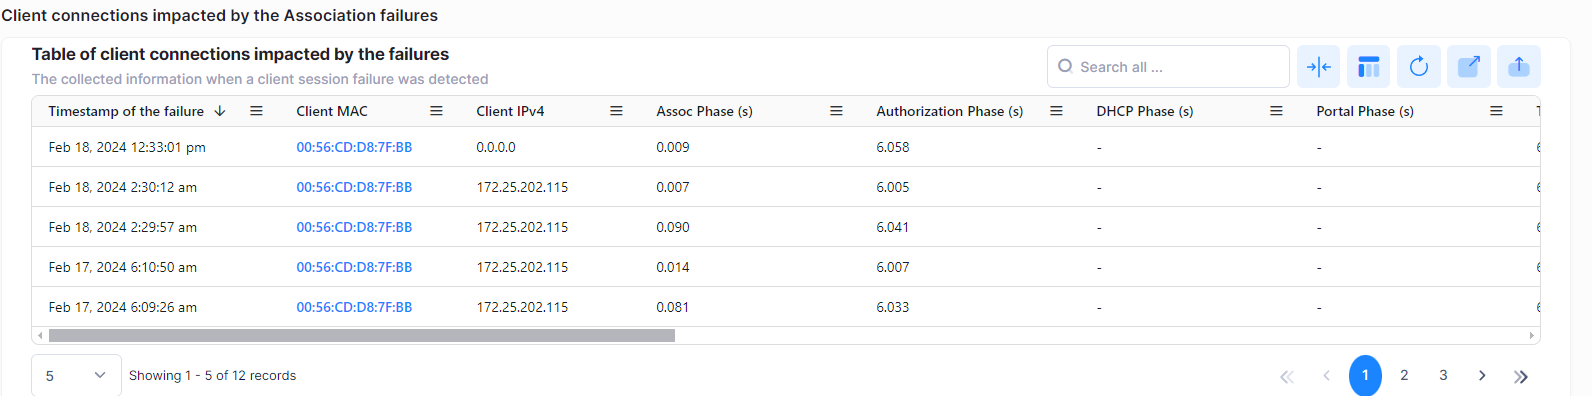
Table of client connections impacted by the failures - This section contains a table displaying the list of client sessions impacted by the failures.
To switch between the available classifiers, simply click on one of the available classifiers in the red block. The Failure Classifiers dashboard will be automatically refreshed.