Monitor Wired Client Sessions
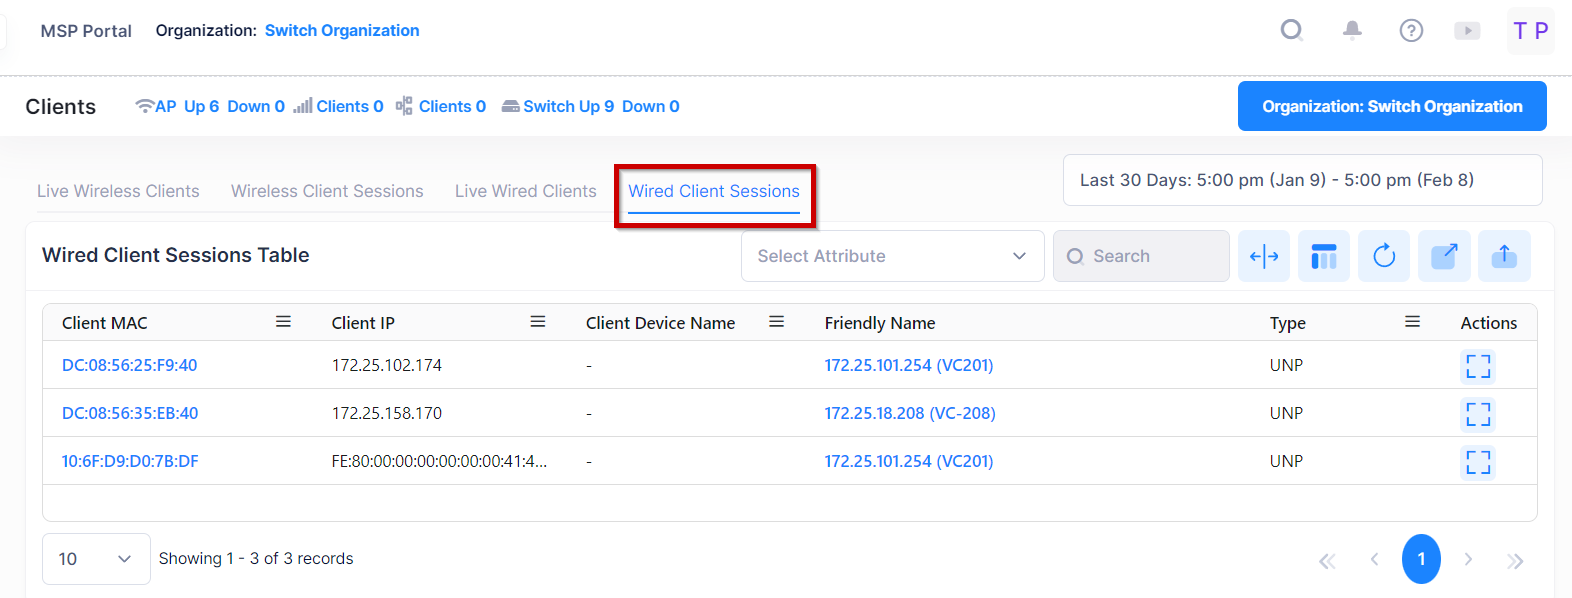
The “Wired Client Sessions” section of the Monitor Clients dashboard displays a list of wired clients sessions. The Wired Client Sessions Table lists sessions associated with managed Devices connected through wired ports during the specified time window range.
The Network Analytics Summary at the top of the dashboard displays the total number of Access Points, Access Points Up, Down Count, number of Live Wireless and Wired Clients, total number of Switches, Switches Up and Down Count in the Network.
Data displayed in the list can be exported into a CSV, PDF or Excel sheet format. You can also display the list in full-screen mode for a better display.
For each historical wired client session, the following attribute values are provided:
Switch Client sessions are displayed only if the Clients are connected to UNP ports. Wired client sessions for Clients not connected to a UNP port (non-UNP Clients) are not included in this list.
Client Device Name - The client Device Name.
Client MAC - The MAC Address of the client.
Client IP - The IP address of the client, if applicable.
Friendly Name - The name assigned to the device is derived from the Preferred Device Naming convention specified in the user preference settings. By default, the Friendly Name is set to IP Address (System Name).
Type - It provides the information that the Client is wired to an Access Point or connected to a Switch as a UNP Client.
Session Duration - The length of time during which the Session was active.
Session Start Time - The date and time on which the Session was started.
Session End Time - The date and time on which the Session ended.
Device MAC - The MAC address of the Device to which the Client is wired.
Switch SN. - The serial number of the Switch to which the wired Client is connected (applies only to UNP Clients).
Port - The name of the wired port.
VLAN - The VLAN which is in use.
Site Name - The Site Name of the Device to which the client is wired.
Client Username - The username used by the Client or UNP profile used by the wired Client (This value can be the same as the Client MAC address value in case MAC authentication is used by the Client).
The Wired Client Sessions table displays the history of closed Clients sessions as well as live Client Sessions.
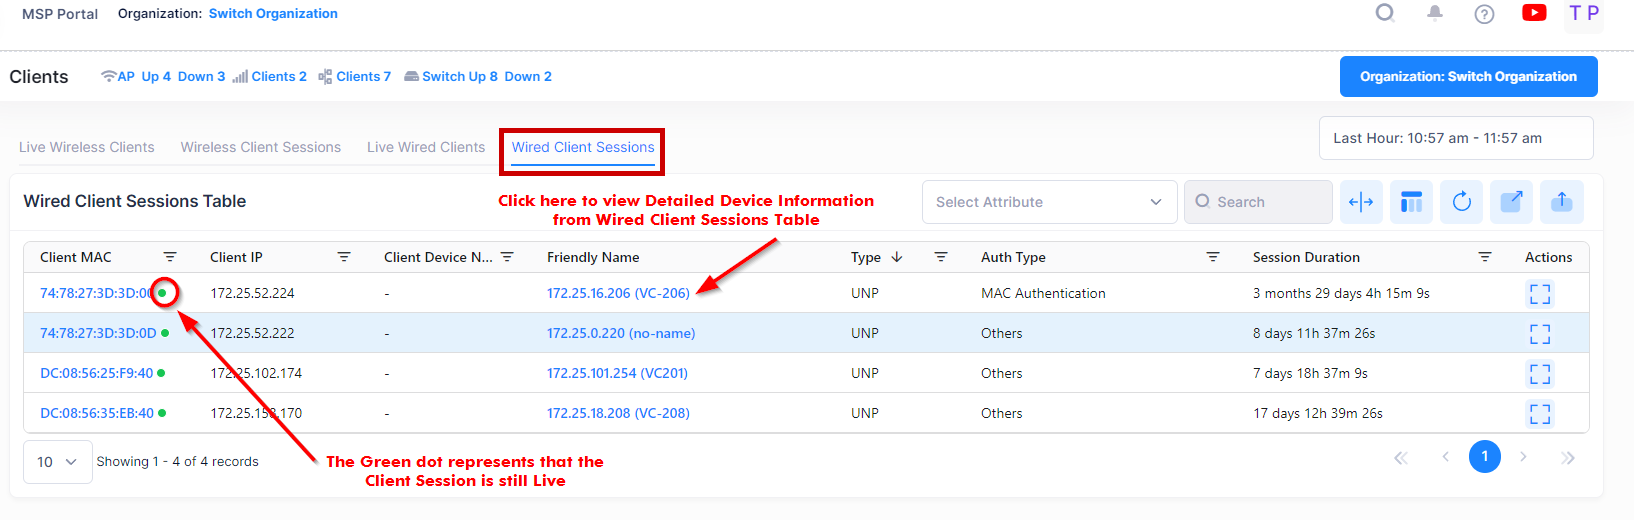
The Green dot in the table represents the live Clients which are connected in the Network.
View Device Information from Wired Client Sessions Table
To view the Device Information from the Wired Client Sessions Table, click on the ‘Friendly Name’ in the table as shown below:
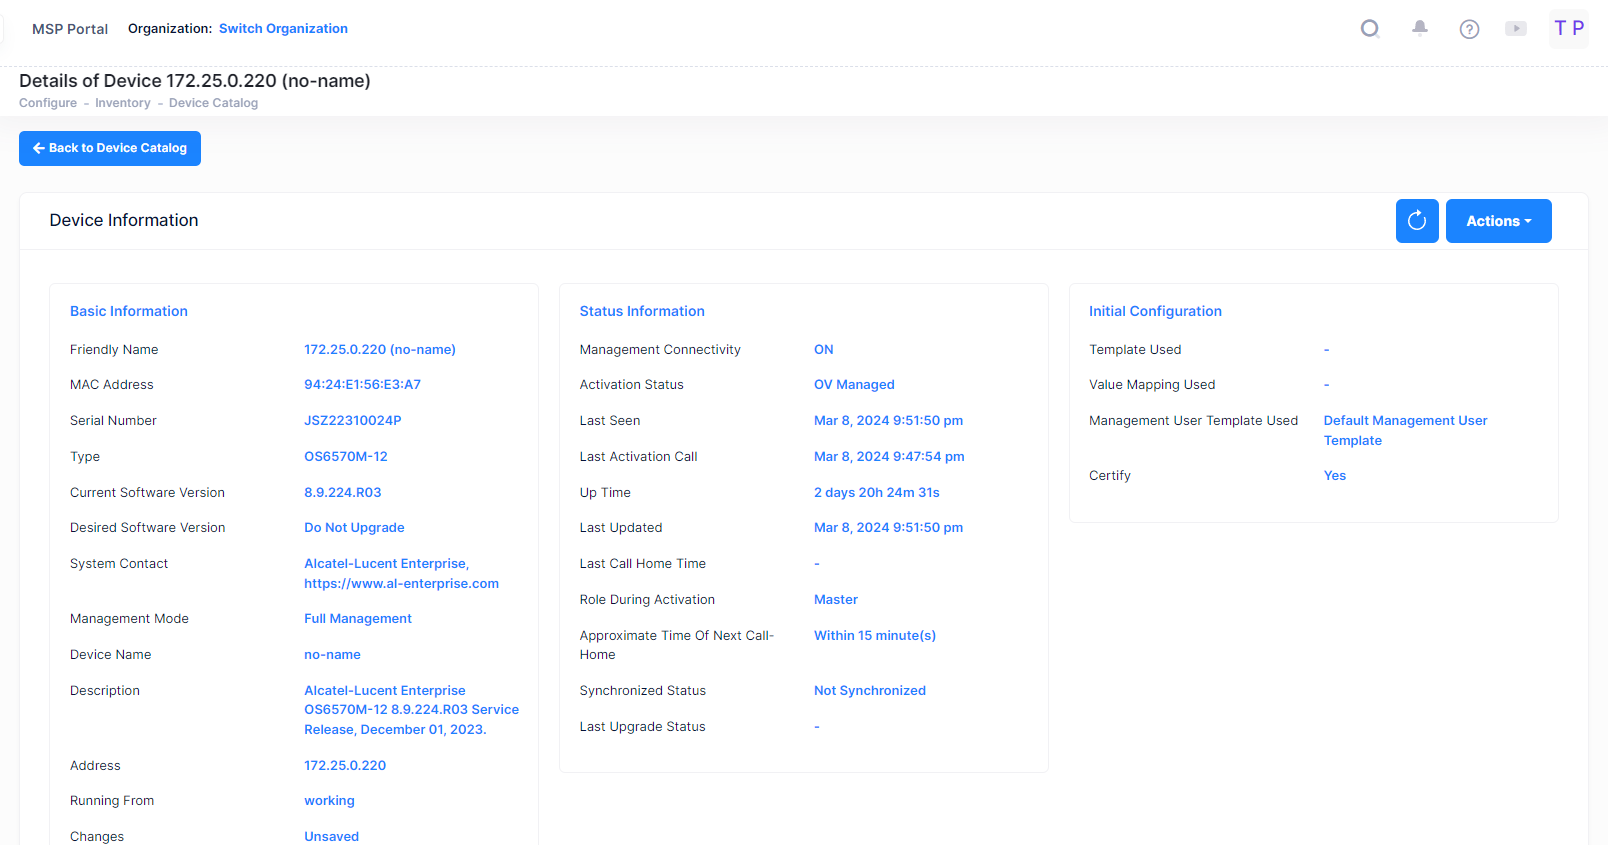
It will redirect you to the Device Catalog screen displaying the Device Information of the selected device. See the Device Catalog online help for more information.
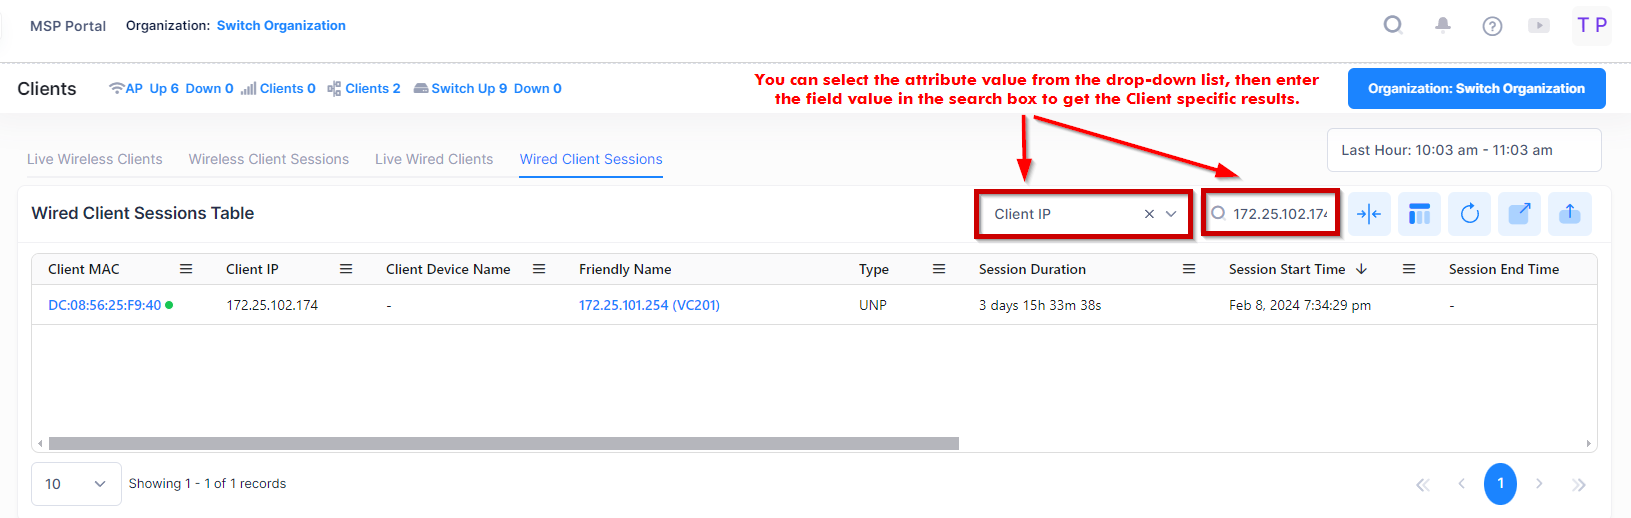
Search Wired Client Sessions by Attribute Value
You can search for Client sessions that exist in the Wired Client Sessions Table List by using the Select Attribute and Search option. The search results are refined based on the attribute value selected from the available drop-down list (Client IP/Client MAC or Client Username). Only those Wired Clients that contain the matching searched attributes are displayed in the search results.
View Client Sessions History
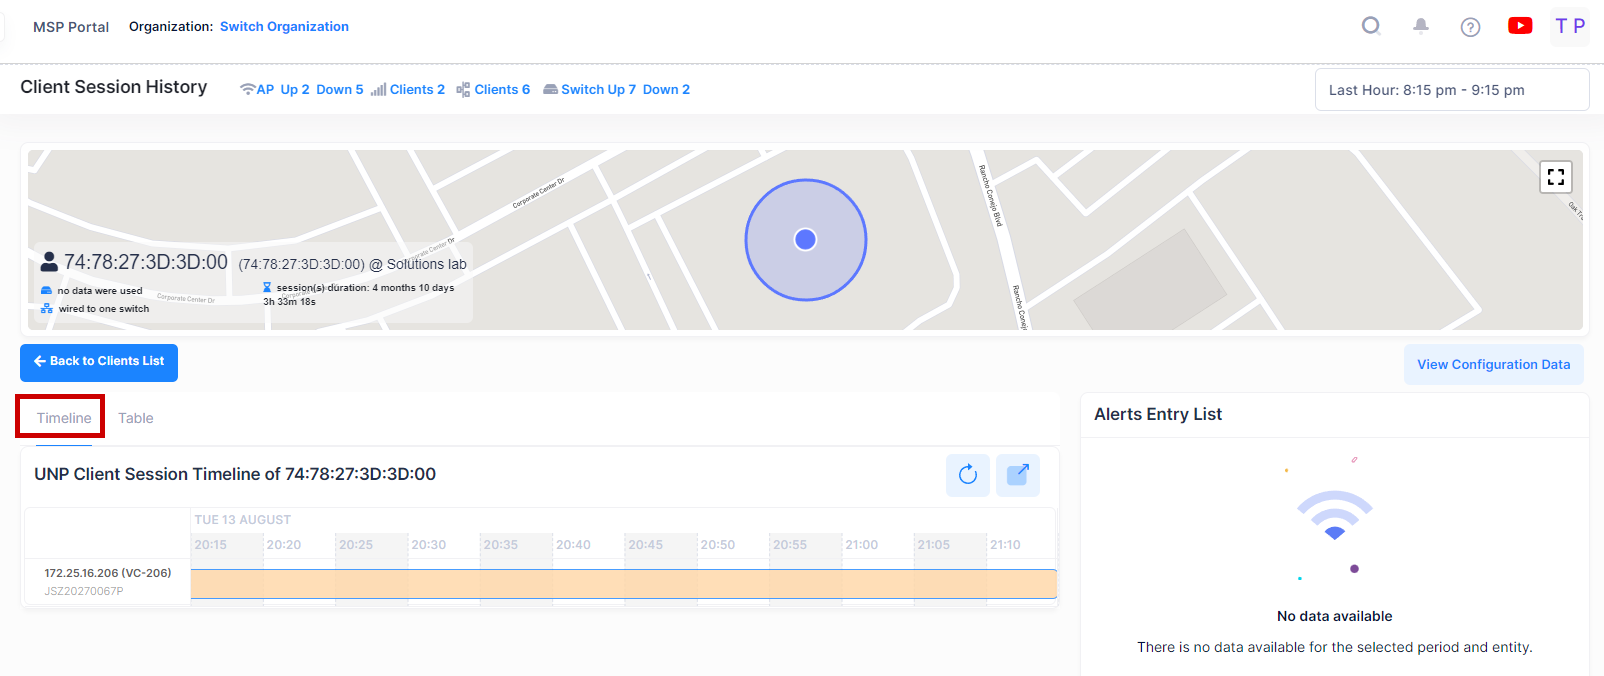
If you want to see more details of the Client activity and Client session history for a particular device, then click on the MAC address of the selected Client, a new window opens dedicated to displaying information for the selected client. As shown below, this new window displays a summary of activities and session timelines for the individual Client.
For each of the Client, you can Monitor the following Client details:
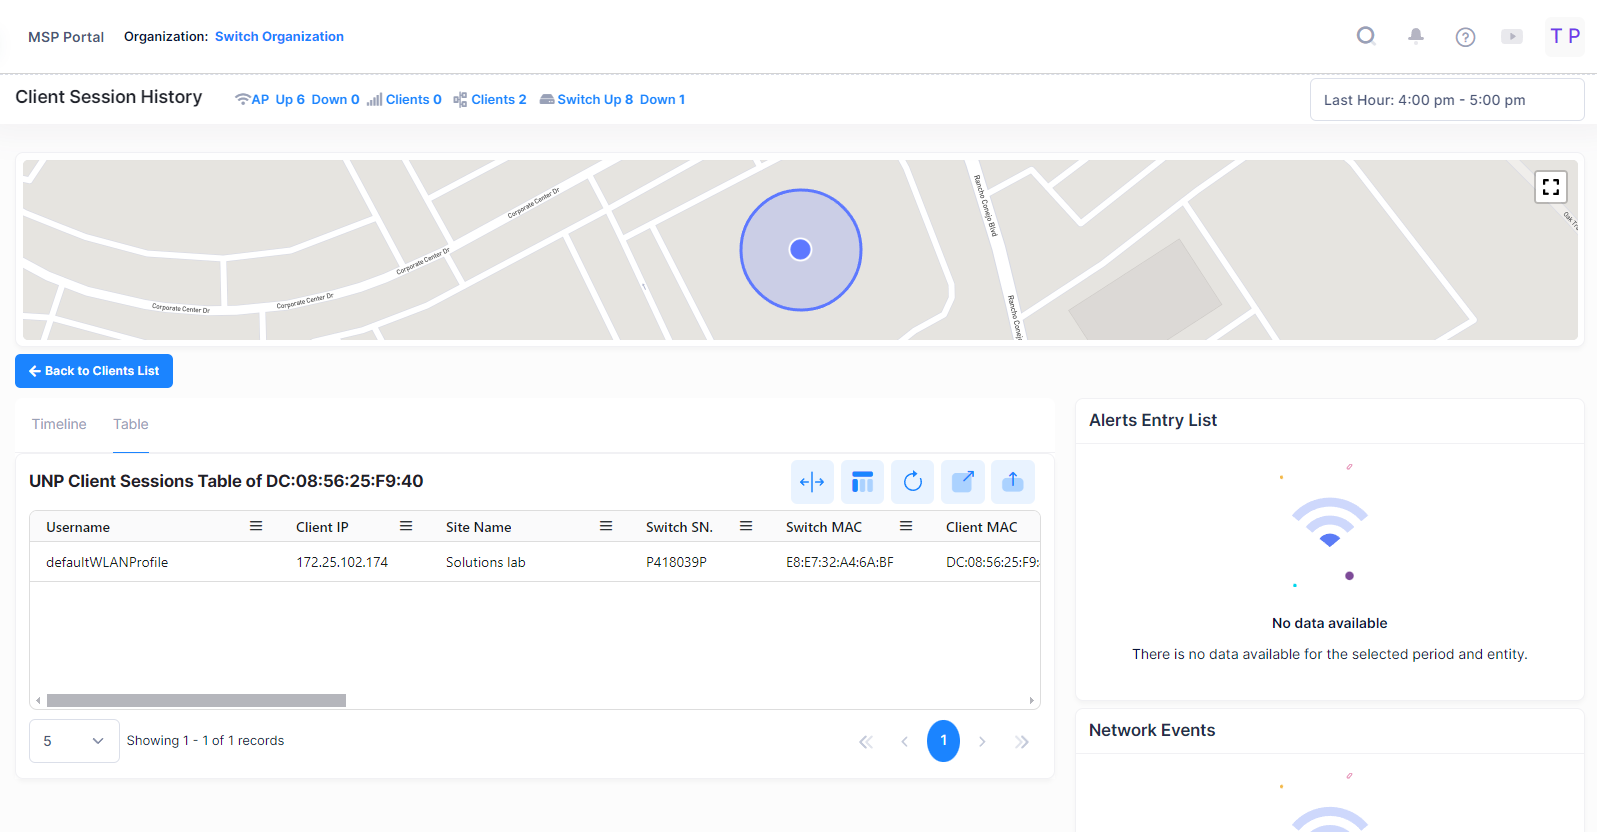
UNP Client Sessions Table of Device - It displays the Session detail of those Clients which are wired to the Switch or Clients which are wired to the Access Point of a device as shown below:
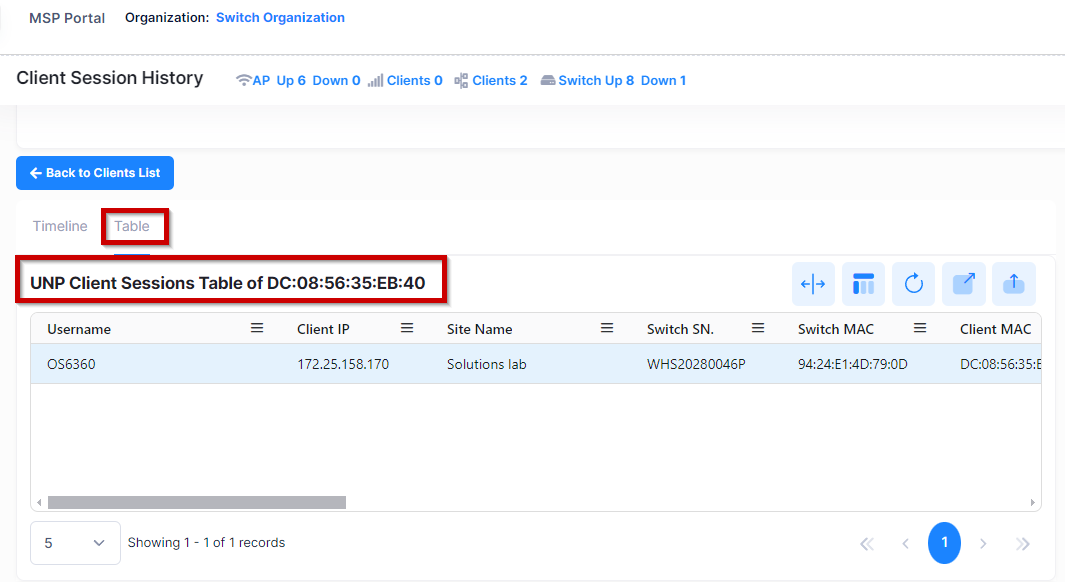
For each UNP session, the following attribute values are provided:
Username - The username used by the Client or UNP profile used by the wired Client (This value can be the same as the Client MAC address value in case MAC authentication is used by the Client).
Switch MAC - The MAC Address of the Device to which the Client is wired.
Client MAC - The MAC Address of the client.
Client IP - The IP address of the client, if applicable.
UNP Profile - The UNP Profile of the Client.
Type - It provides the information that the Client is wired to an Access Point or connected to a Switch as a UNP Client.
Session Duration - The length of time during which the Session was active.
Session Start Time - The date and time on which the Session was started.
Session End Time - The date and time on which the Session ended.
Switch SN. - The serial number of the Switch to which the Client wired with (applicable for UNP Clients only).
Port - The name of the wired port.
VLAN - The VLAN which is in use.
Authentication Type - The authentication type used by the client (e.g., WPA2_WPA, PSK, …)
Site Name - The Site Name of the Device to which the client is wired.
Tx Total - The total number of bytes transmitted to the client during the session.
Rx Total - The total number of bytes received by the client during the session.
Tx Packets - The total number of packets transmitted to the client during the session.
Rx Packets - The total number of packets received by the client during the session.
Wired Client Session History - It displays the Wired Session History detail of Clients which are wired to the Switch or Clients which are wired to the Access Point of a device as shown below:
Alerts Entry List - It displays the Alerts for the Client all devices within the Organization scope and specified timeframe and updated in real-time.
Network Events - The Network Events screen displays configured events received from device and provides basic event information (for example, severity, date/time received).