OmniVista Cirrus 10 provides focused dashboards to support common use-case and enables you to display a specific set of metrics and data points on one screen. You can use custom dashboards to view selected metrics and a relatively narrow or focused view of the data.
To create a custom dashboard:
-
Go to the Organization Dashboard screen.
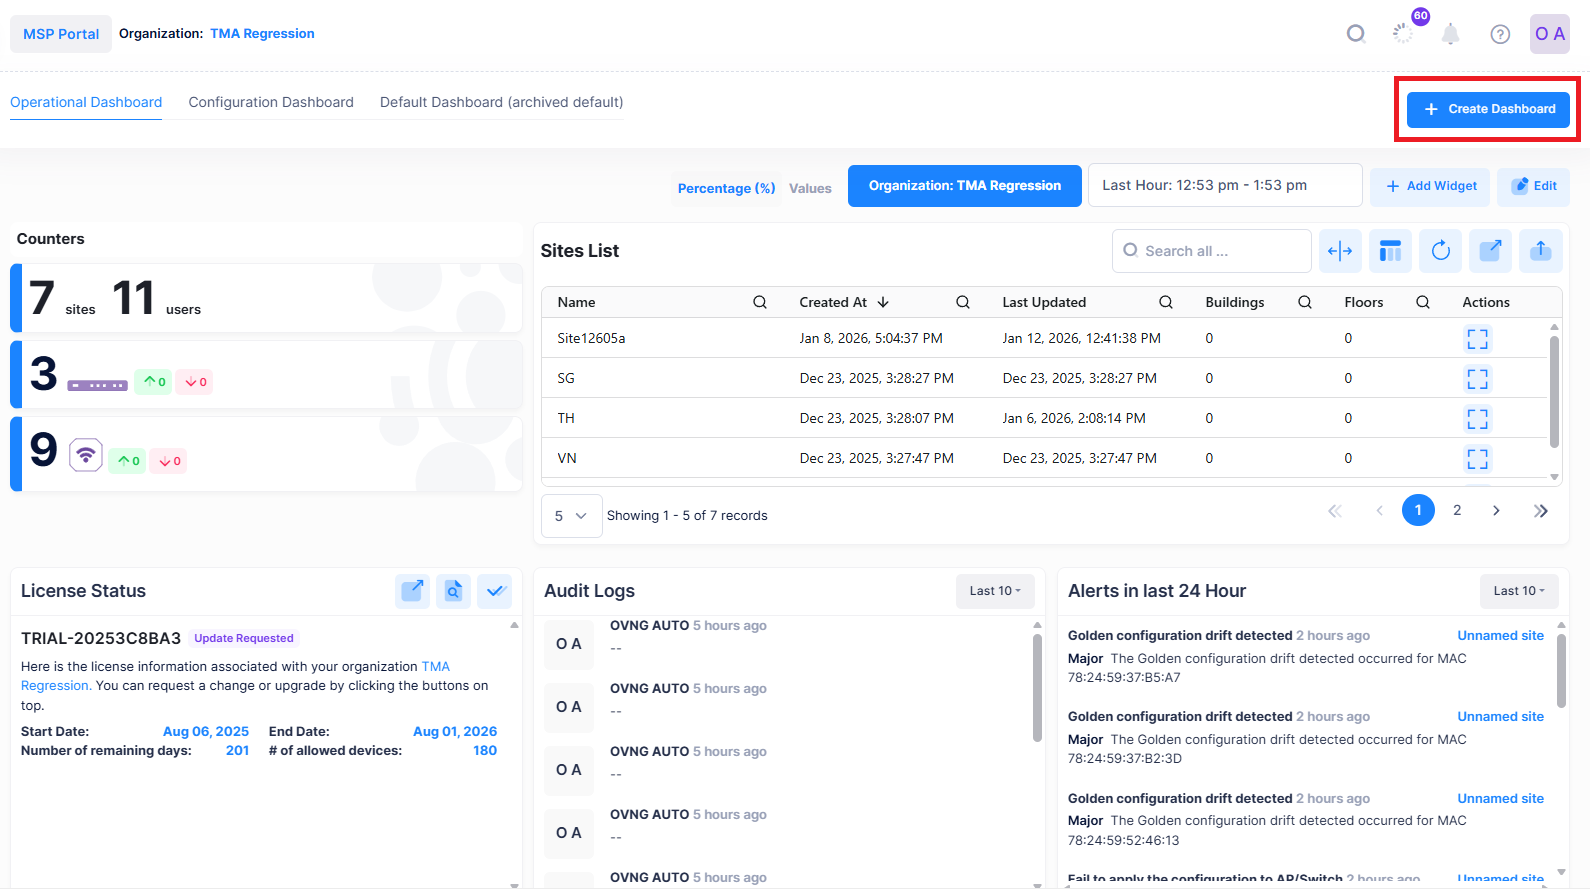
Organization Dashboard -
Click on + Create Dashboard in the right top corner of the screen. The New Dashboard window opens.
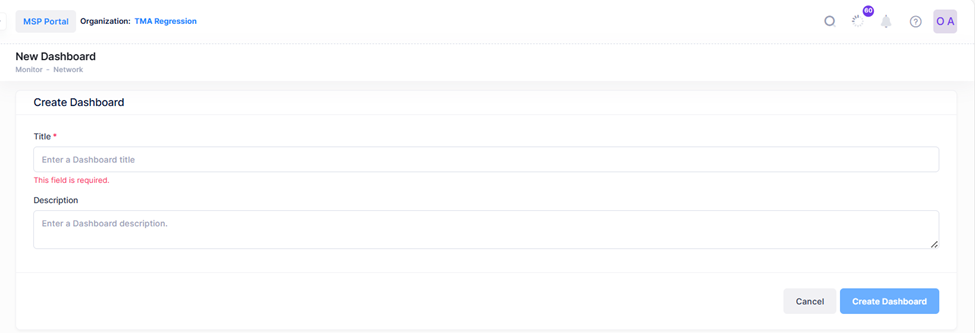
Create Dashboard Screen -
Enter the Title and Description for the new dashboard and click Create Dashboard.
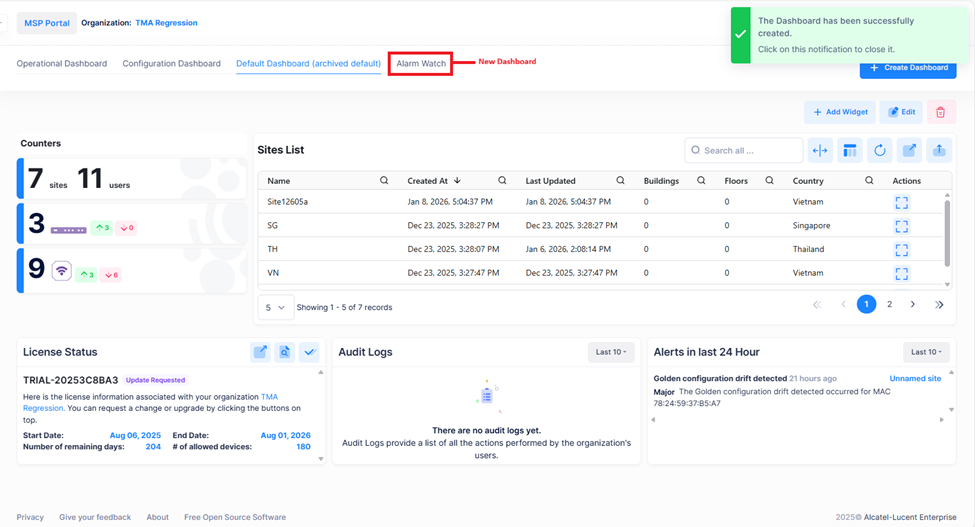
The new dashboard is created and displayed. In the above sample screen Alarm Watch is the custom dashboard created.
Once the new dashboard is created you can:
-
Add the required widgets. See Adding a Widget.
-
Edit the widgets. See Editing a Widget.
-
Delete the dashboard. See Delete a Custom Dashboard.