The Access Point Network Analytics section of the Network Analytics Dashboard provides information to help monitor and evaluate the Access Points performance metrics.
Data displayed can be exported into a CSV, PDF or Excel sheet format. You can also switch to full-screen mode for a better display.
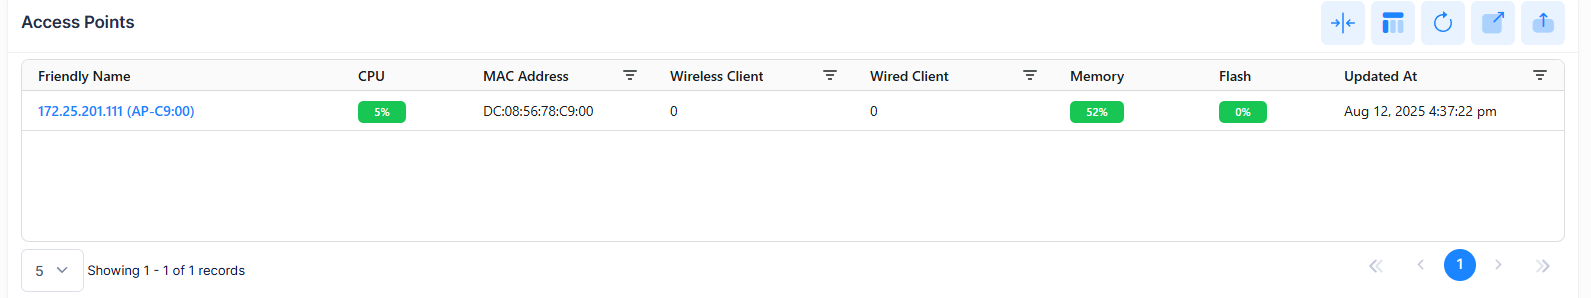
The Access Points field values provide the following information:
-
Friendly Name - The name assigned to the device is derived from the Preferred Device Naming convention specified in the user preference settings. By default, the Friendly Name is set to IP Address (System Name).
-
MAC Address - The Access Point MAC address.
-
Wireless Client - The number of Wireless Clients connected to the Access Point.
-
Wired Client - The number of Wired Clients connected to the Access Point.
-
CPU - The CPU Usage of the Access Point device.
-
Memory - The Memory Usage of the Access Point device.
-
Flash - The Flash Usage of the Access Point device.
-
Updated At - The time of the last event received from the Access Point that was used to calculate the Uptime or downtime.
Note: The Access Points table displays only those Devices which are fully connected and managed with OmniVista Cirrus 10 monitoring agent. The Devices which are not active will not be displayed here.
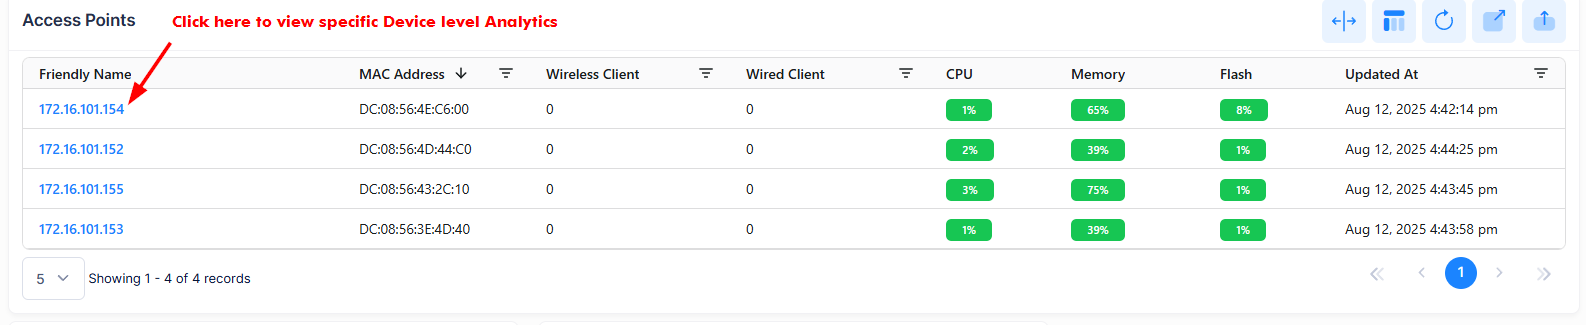
To explore specific Device Level Analytics, click on the specific ‘Friendly Name’ in the Device List Table to view the detailed Analytics of a particular Access Point as shown below.
The Device level Network Analytics screen displays filters on the dashboard to define the scope of activity that you want to monitor within a specific window of time.
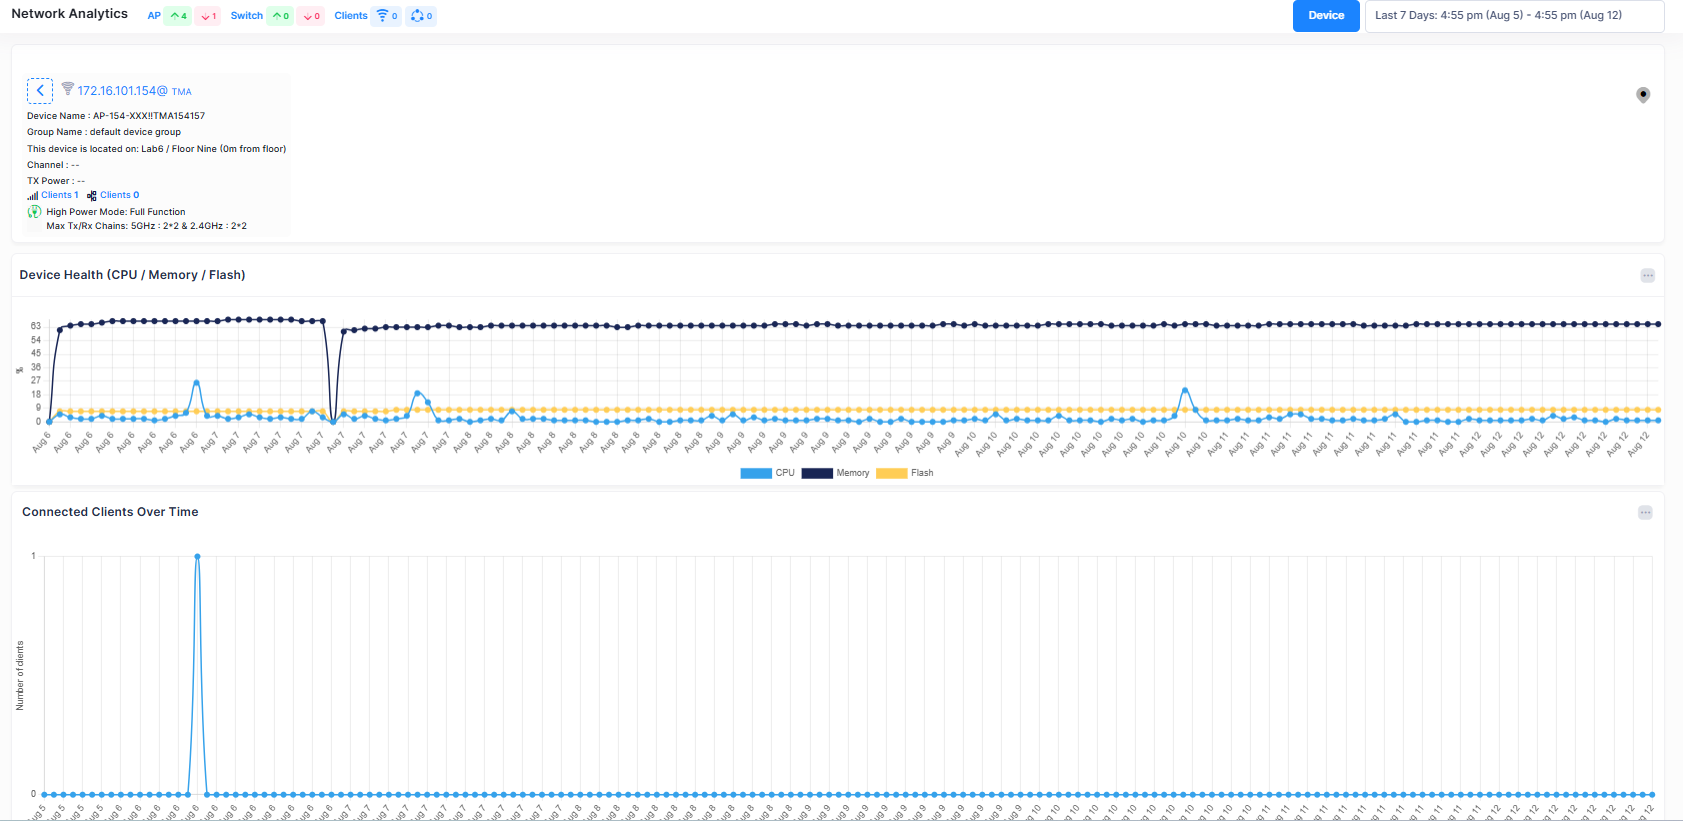
The following parameters can be monitored by using above Charts and Tables to evaluate the Device Analytics Trend.
-
Device Health Trend (CPU/Memory/Flash)
-
Number of Current Connected Clients Over Time
-
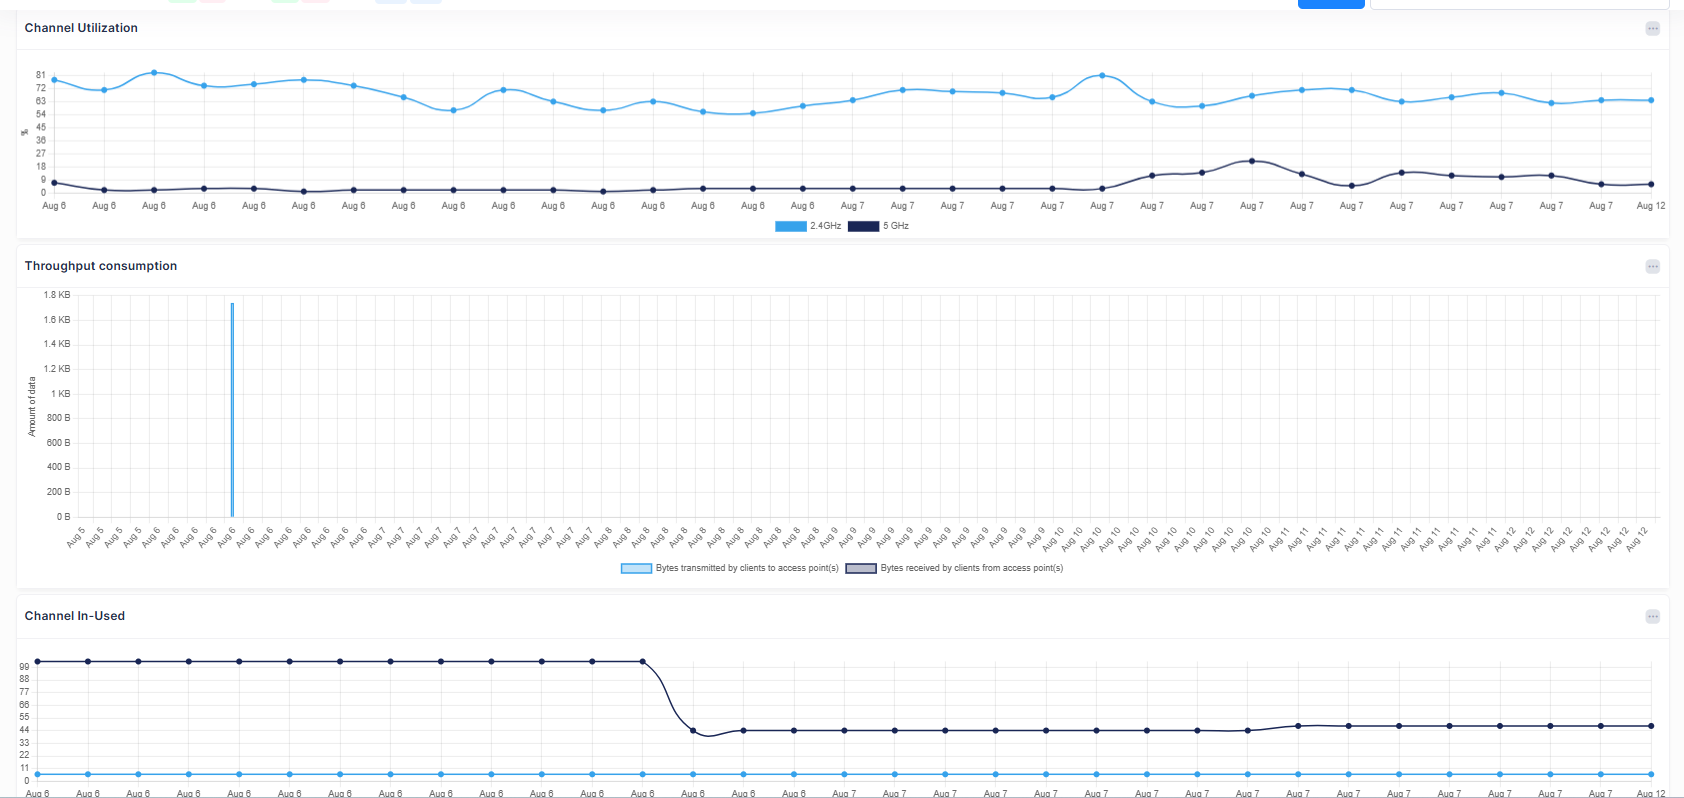
Current Channel Utilization 2.4 GHz/5 GHz/6 GHz
-
Current Channel In-Use Trend 2.4 GHz/5 GHz/6 GHz
-
Throughput Consumption
-
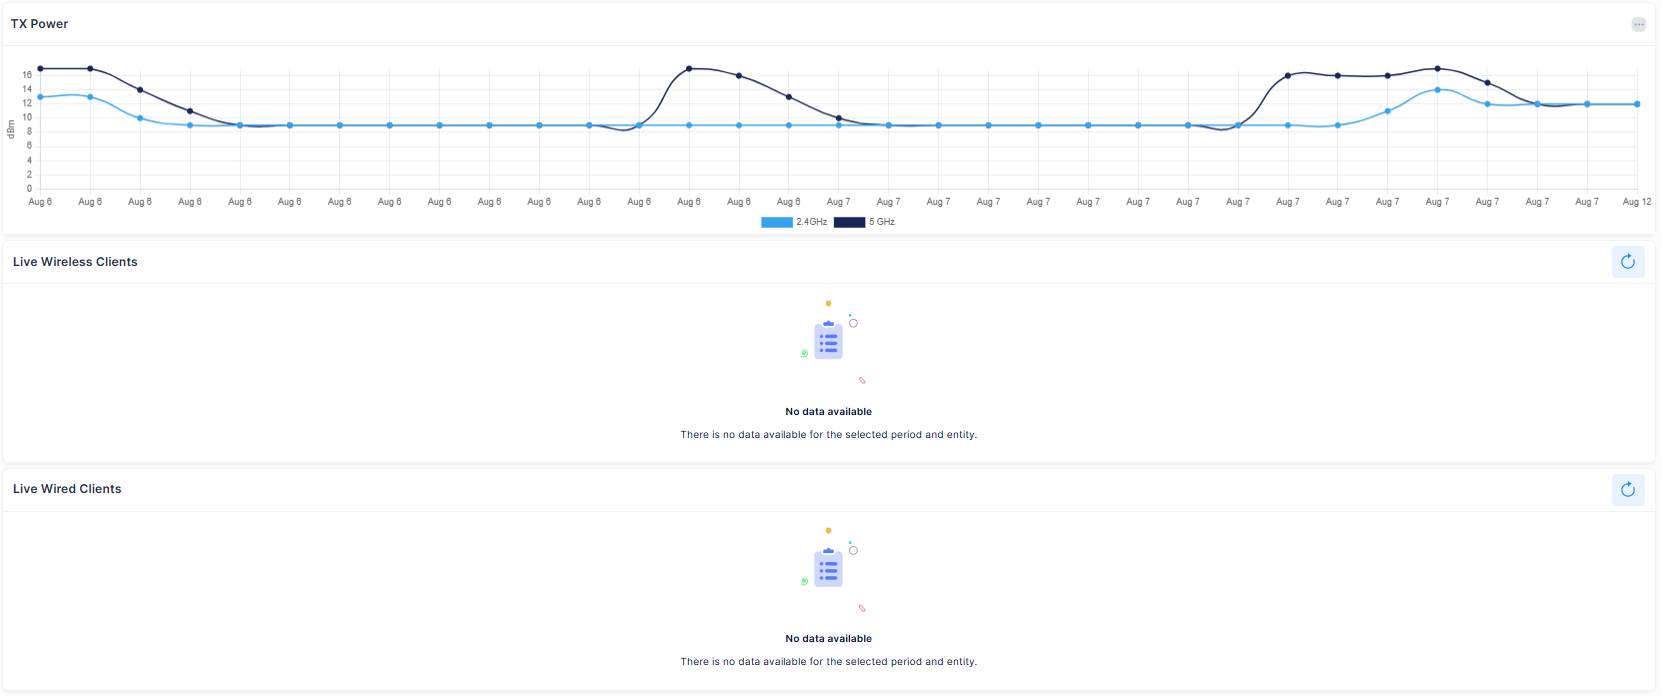
Current Tx Power 2.4GHz/5GHz/6 GHz
-
Live Wireless Clients
-
Live Wired Clients
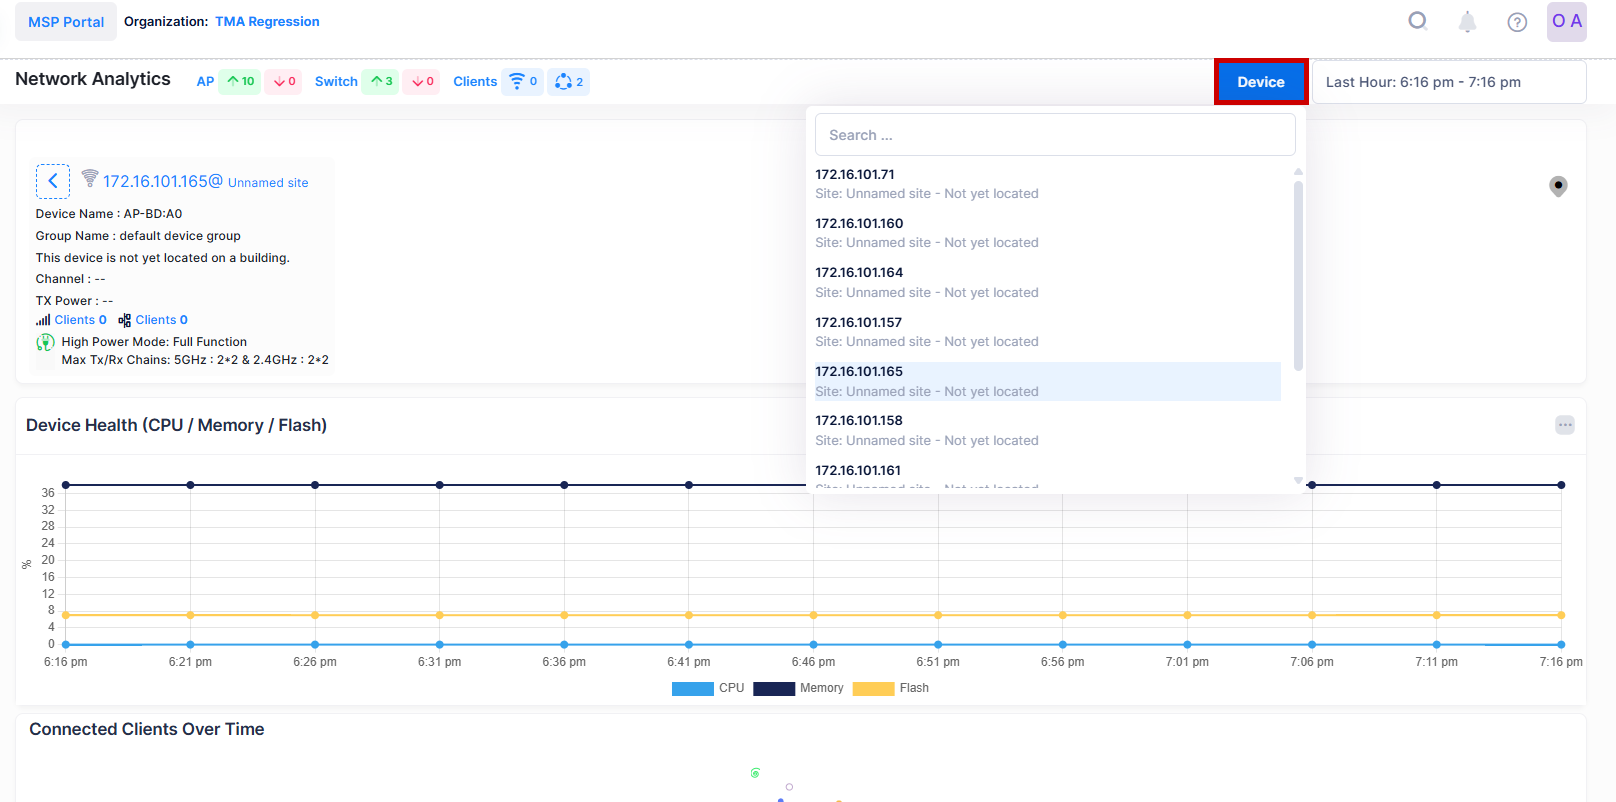
When you click on the Device button, it displays a drop-down list of the Access Points on the Access Points list. You can choose another Access Points from the list by selecting an Access Point from the menu, to view the device level analytics of other devices without returning to the Network Analytics screen as shown below.