Device Health (CPU / Memory / Flash) Metrics
The Device Health section of the Network Analytics Dashboard provides the information to help monitor and evaluate the latest Device Health status metrics.
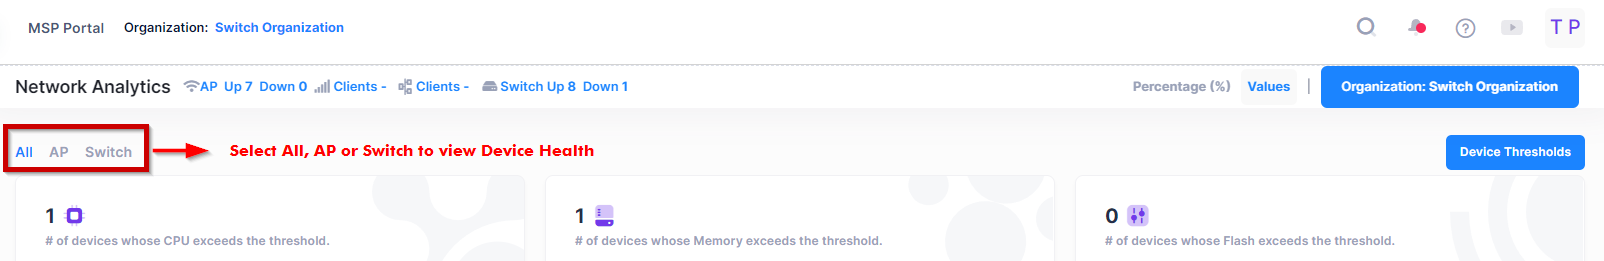
There are three options available to view the Device Health from this screen:
All - Displays a list of all devices (Access Points and Switches).
AP - Displays a list of Access Points.
Switch - Displays a list of Switches.
By default, all devices are selected. Click on All, AP, or Switch to view the related device health performance.
From this screen, you can perform any of the following actions:
The CPU and memory health threshold values are configurable for a specific device; the CPU, memory, and flash health threshold values are configurable for all Devices associated with a specific Site. Note that device threshold values take precedence over Site threshold values. See the Configure Network Analytics Thresholds online help for more information.
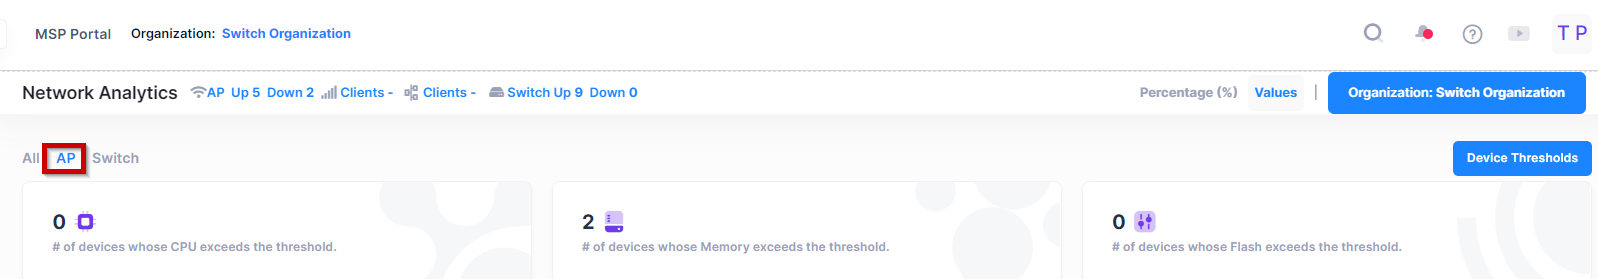
Access Points Health Trend
The Access Point Health section provides the following information to help monitor and evaluate Device health:
The number of Devices with CPU usage that exceeds the threshold value.
The number of Devices with memory usage that exceeds the threshold value.
The number of Devices with flash usage exceeds the threshold value.
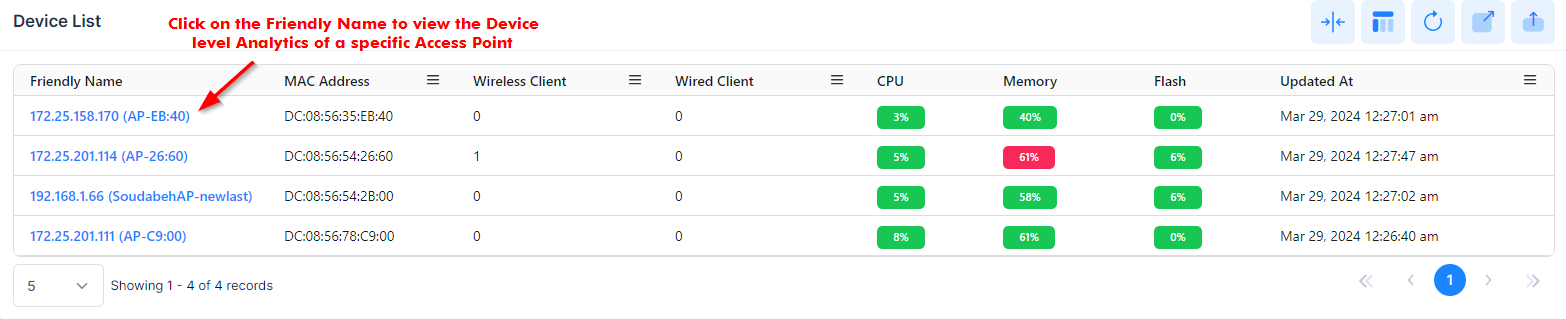
To view the latest percentage-wise status of CPU, memory, and flash usage for the devices, go to the “Device List” table.
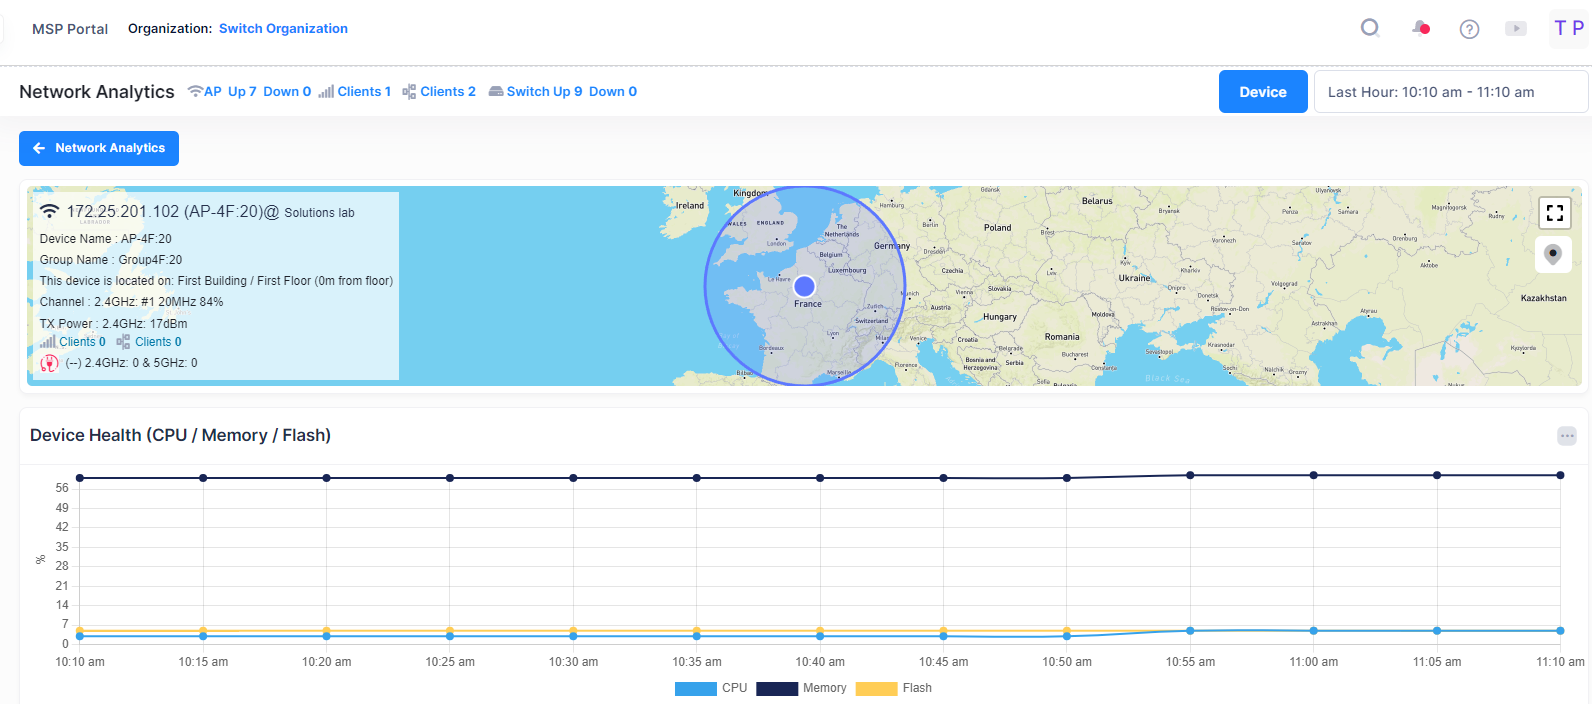
You can click on a specific Friendly Name in the “Device List” Table, then you will be directed to the Device Detail Single view page which displays the history trend of Device Health Metrics as shown below.
The Device Level Health Trend is shown below for specific Device which is selected for a selected time window range.
Switch Health Trend
To view the Switch Health Metrics, select the Switch tab to monitor and evaluate the following Switch Health metrics as shown below:
The number of Devices with CPU usage that exceeds the threshold value.
The number of Devices with memory usage that exceeds the threshold value.
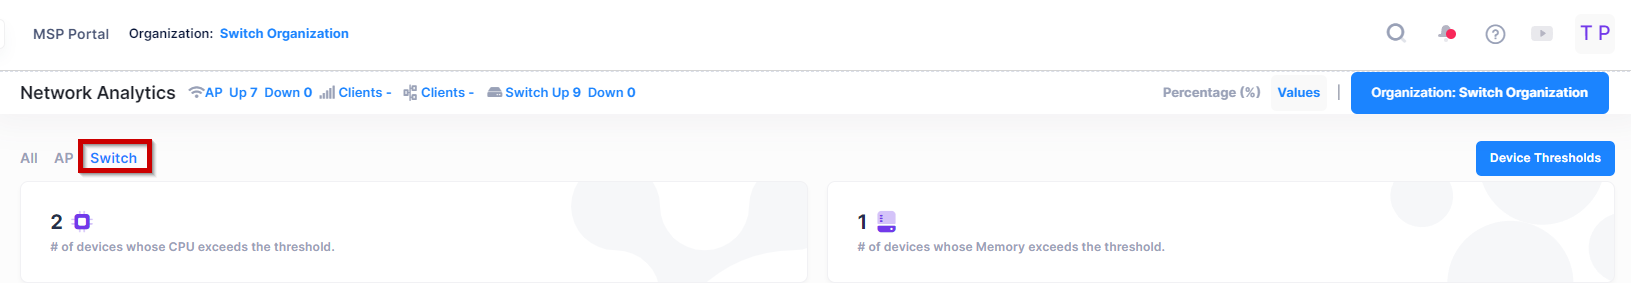
Note: The Switches do not report the Flash Health values to the OmniVista Cirrus.
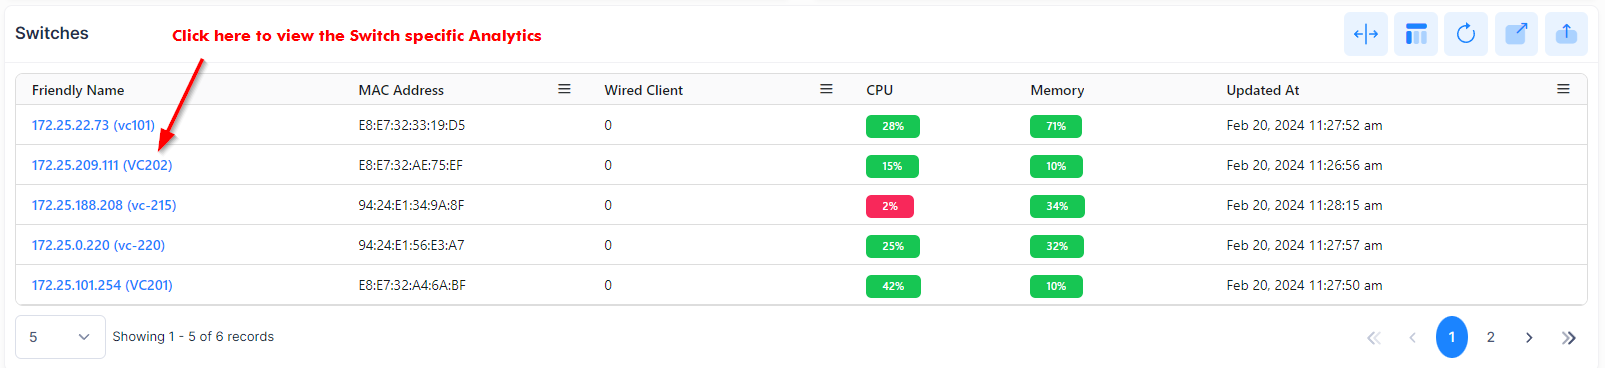
To view the latest percentage-wise status of CPU and memory usage for the devices, go to the “Device List” table.
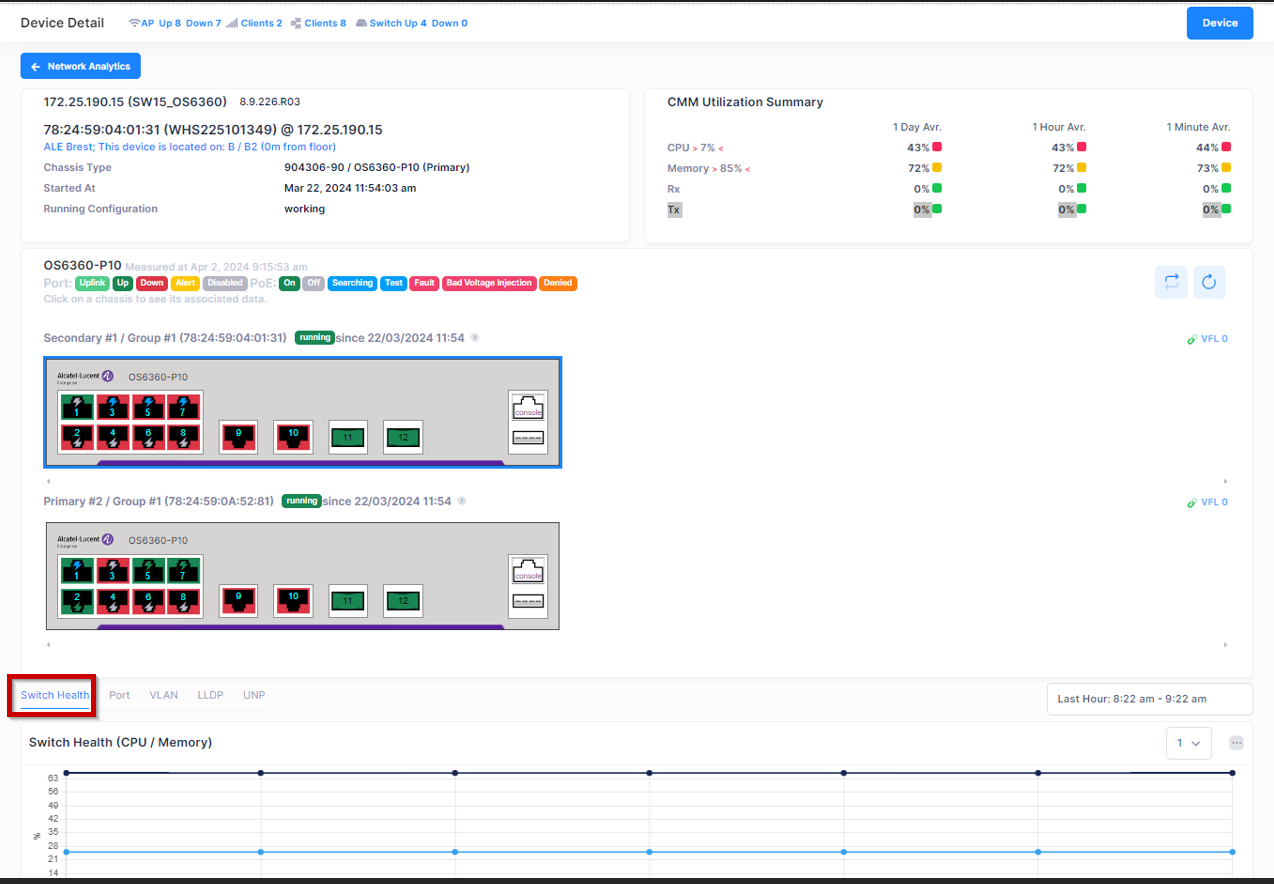
By Clicking on a specific Friendly Name in the “Device List” Table, you will be directed to the Device Detail Single view page which displays the various parameters of Switch Health Metrics as shown below.
It will redirects you to the Device Detail screen for Switches. The Switch Level Health Trend is shown below for specific Device which is selected for a selected time window range.
Note: The number of devices over the threshold is computed between the Device Threshold and the Health Threshold values. (if the device is not listed in Device Threshold)