The Network Advisor Dashboard is presented at login. This Dashboard provides an overview of the number of network devices managed by Network Advisor, including statistics for anomaly activity (such as how many active anomalies, summary of when anomalies were received). The Dashboard also provides a list of Rainbow Bubbles that are receiving Anomaly Notifications and an overview of the Network Advisor license information.
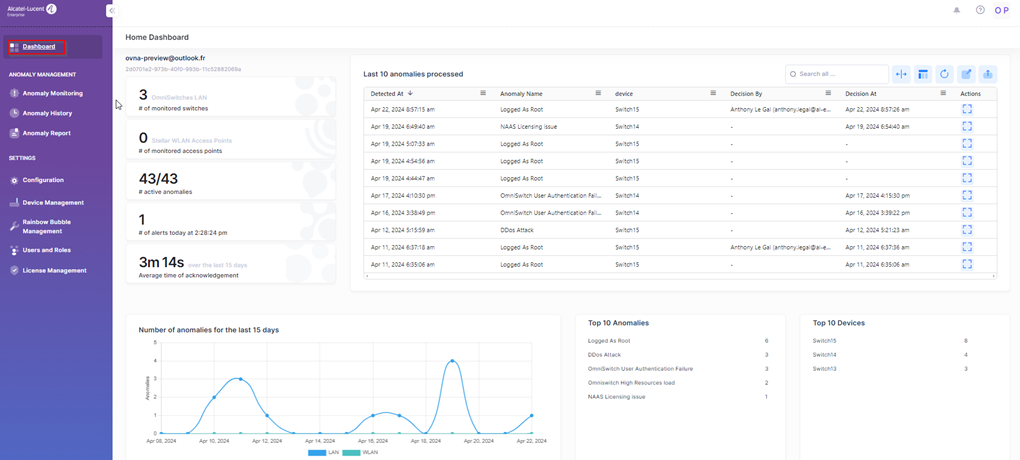
The Network Advisor Dashboard provides the following methods to access and analyze information about network status and usage:
-
Network Monitoring Summary – Displays summary information about the Network Advisor instance and device monitoring activity.
-
Dashboard Shortcut Widgets – Click on the link available in the summary widgets to open the related screen to get more information.
-
Network Advisor Menu – On the left-hand side of the Dashboard, you can click on the menu items to access Network Advisor functionality.
Updated User Interface
The interface of OmniVista Network Advisor has been redesigned to provide a more user friendly interface. This section provides an overview of the OmniVista Network Advisor User Interface, including common tools used for working with tables and graphical displays, as well as the OmniVista Network Advisor Menu which is used to access OmniVista Network Advisor functions and applications.
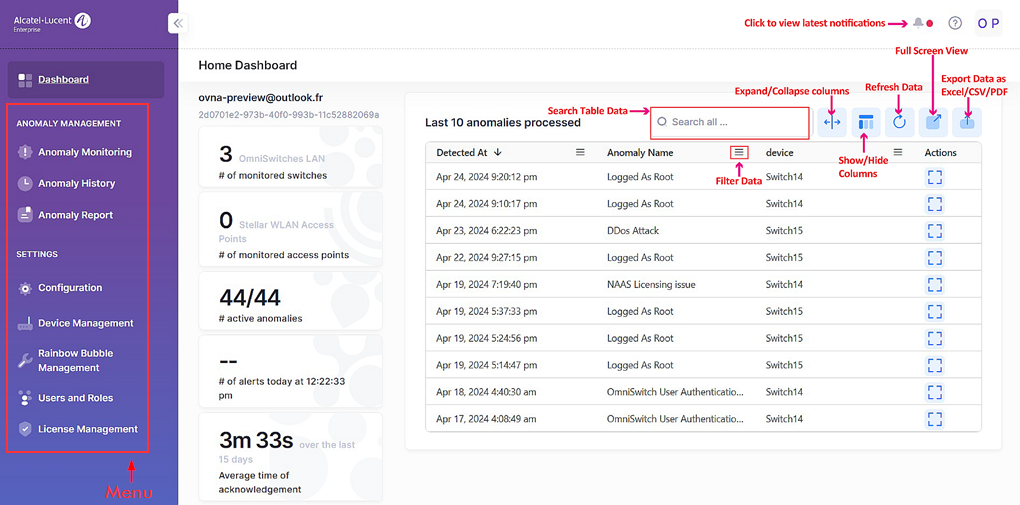
UI Functions
-
Search all - Enter specific name of an anomaly or device to search.
-
Reflexive/Full View (Expand/Collapse columns) - By default, the display is set to Reflexive View, which automatically sizes tables (limiting the columns displayed) based on the display area available. Click on the icon to toggle to Full View and display all columns in a table. Click on the icon again to return to Reflexive View.
-
Refresh Data - Click on the refresh button to retrieve the most recent data from the OmniVista Cirrus database.
-
Full Screen View - Click on the icon to display the table in Full View (the table will expand to cover the entire screen. Click on the Quit full screen mode button or press Esc to return to the default view.
-
Export - Click on the Export button to export the table to an Excel, CSV or PDF file.
Network Monitoring Summary
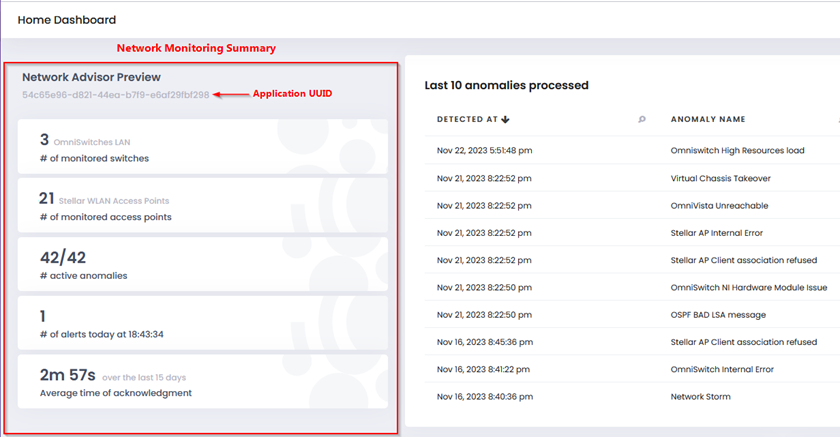
The Network Monitoring Summary section of the Network Advisor Dashboard provides the following information:
-
The name assigned to the Network Advisor instance (for example, “Network Advisor Preview”) during the installation process.
-
The Application UUID generated for the instance. Note that the UUID is unique for each Network Advisor instance and is required when you define the instance for integration with OmniVista 2500 NMS or OmniVista Cirrus.
-
The number of devices monitored (Switches/Access Points).
-
The number of active anomalies.
-
The number of alerts generated at the specified day and time.
-
The average amount of time in which acknowledgements were made during the last 15 days.
Dashboard Shortcut Widgets
The following summary widgets are available on the Network Advisor Dashboard. You can click on the widget title go directly to the Network Advisor screen for more information.
Last 10 Anomalies Processed
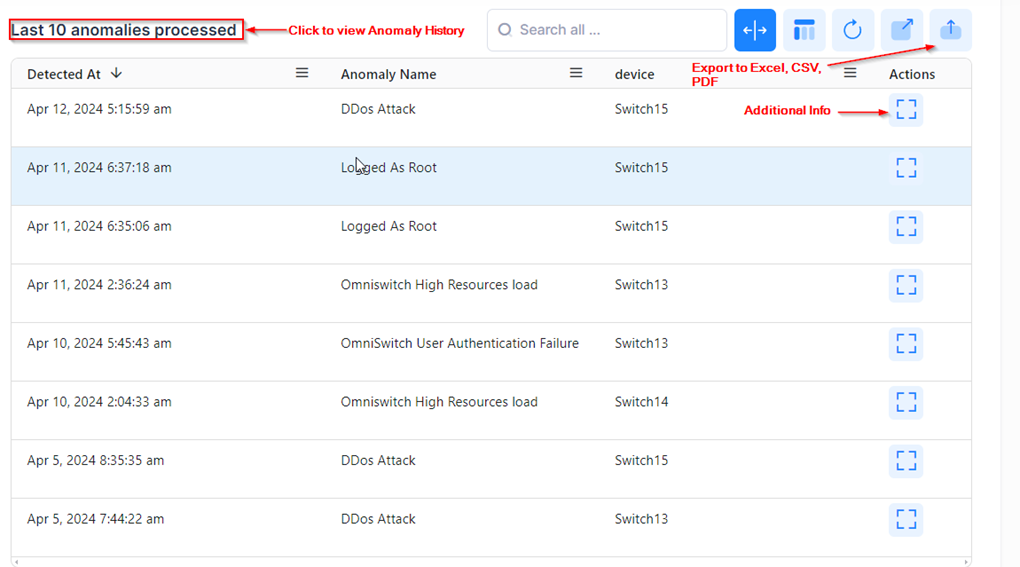
This widget displays the following information about the last 10 anomalies processed:
-
Detected At – The date and time the anomaly occurred.
-
Anomaly Name – The name of the anomaly that was detected.
-
Device – The device from which the anomaly was detected.
-
Decision By – The Rainbow Bubble user that responded to the anomaly.
-
Decision At – The date and time the Rainbow Bubble user responded to the anomaly.
-
Details – The action that triggered the anomaly notification.
Click on the widget title to view the full Anomaly History list.
Number of Anomalies for the Last 15 Days
A graphical display of anomaly activity that shows the number of anomalies seen over the last 15 days. You can move your cursor along the graph to view specific days and download the graph to an Excel, CSV, or PNG file. Note that information is shown for both switches (LAN) and Access Points (WLAN).
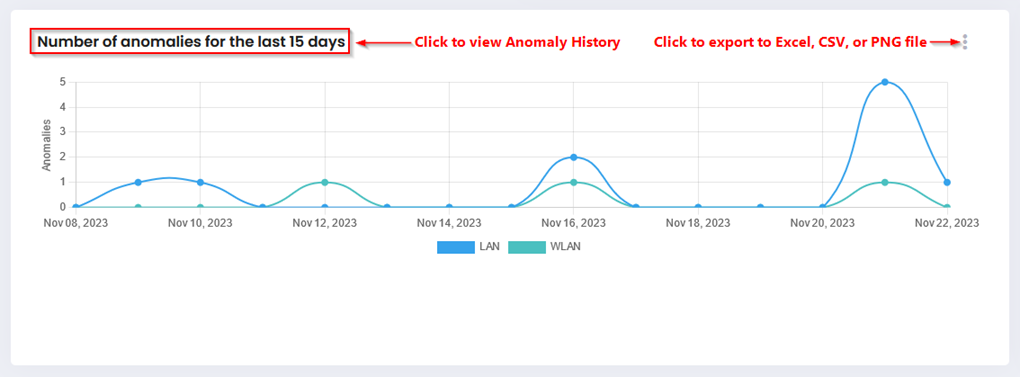
Click on the widget title to view the Anomaly History list.
Top 10 Anomalies
Displays a list of the top 10 anomalies for which notifications were received.
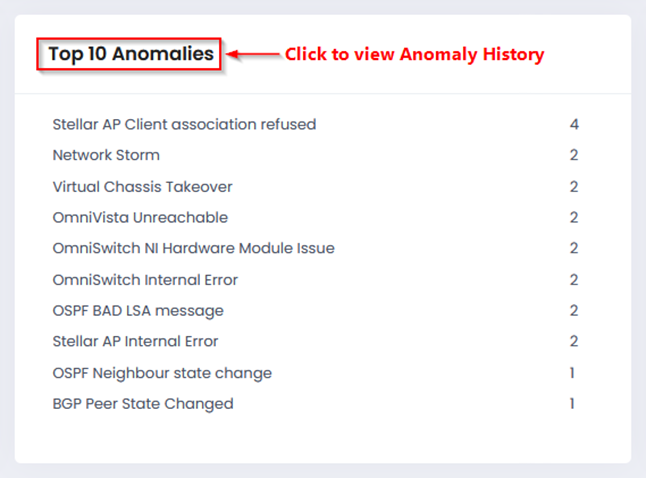
Click on the widget title to view the Anomaly History list.
Top 10 Devices
Displays a list of the top 10 devices with the highest number of anomalies.
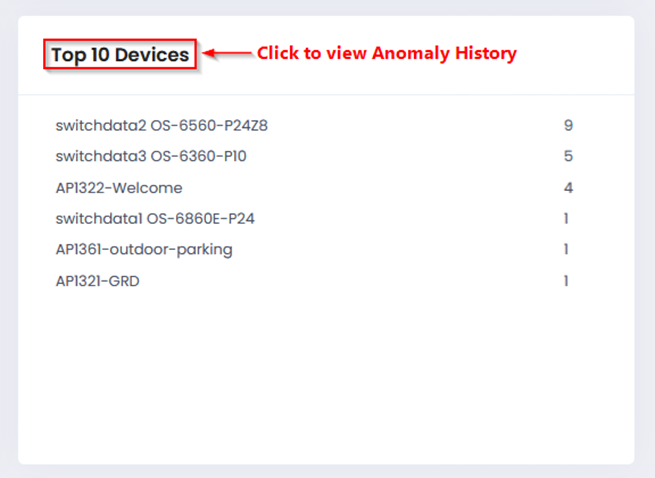
Click on the widget title to view the Anomaly History list.
Your Rainbow Bubbles
Displays the Rainbow Bubbles configured to receive Network Advisor anomaly notifications.
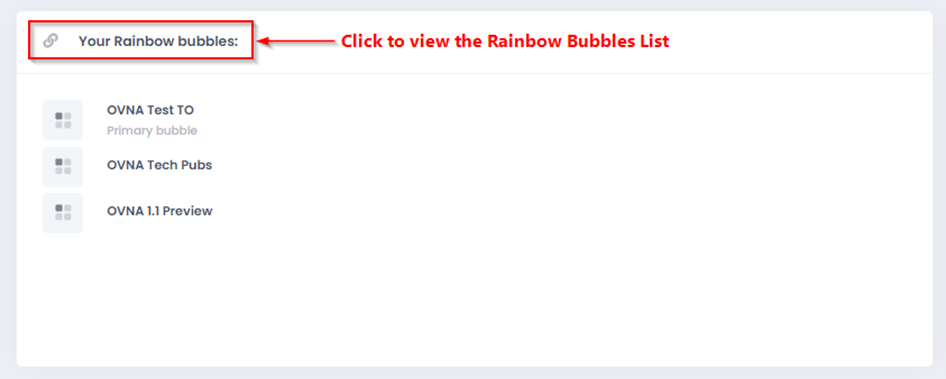
Click on the widget title to view the Rainbow Bubbles list for more information.
License Status
Displays the active license along with the license start and end dates.
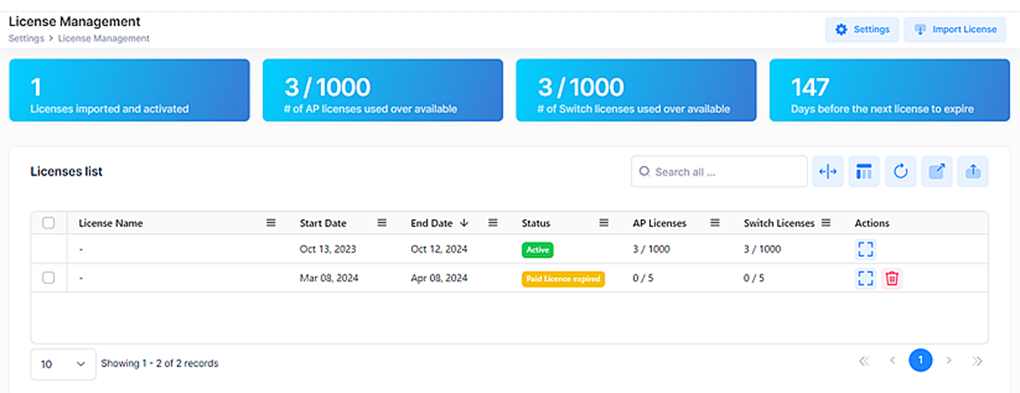
Click on License Status or More details to open the License Management screen.
Network Advisor Menu
On the left-hand side of the Dashboard, the Network Advisor menu provides links to features that are used to monitor network devices. The following functions can be performed from this menu.
-
Anomaly Monitoring – Display and manage anomalies used to monitor devices.
-
Anomaly History – Display a history of detected anomalies that you can analyze to detect patterns of network behavior.
-
Anomaly Report – Used to create instant or scheduled reports.
-
Configuration – Display application settings for Network Advisor and configure default device settings.
-
Device Management – Add and manage devices that Network Advisor will monitor.
-
Rainbow Bubble Management – Create and manage Rainbow Bubbles that will receive Network Advisor anomaly notifications.
-
Users and Roles Management – Configure and manage user-access to Network Advisor.
-
License Management – Display information about the current Network Advisor license. You can also import a new license or request an update to an existing license.