Connected Duration Within the Hourly Selection
The Connected Duration within the Hourly Selection section of the Client Analytics Dashboard displays widgets that display statistics about the average duration of client sessions for the chosen hour range.
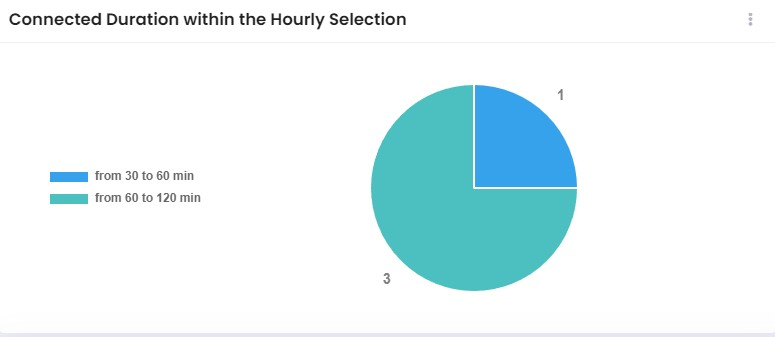
The Connected Duration within the Hourly Selection pie chart provides the distribution of the session duration across five predefined time windows:
From 0 to 10 min
From 10 to 30 min
From 30 to 60 min
From 60 to 120 min
Data displayed in the pie chart widget can be exported into a CSV or Excel sheet format. You can also switch the widget to full-screen mode for a better display.
The Connected Duration within the Hourly Selection tables provide an overview of all sessions that occurred in the selected hour range for each of Wireless and Wired Clients. Data displayed in the table can be exported into a CSV, Excel sheet, or PDF format.
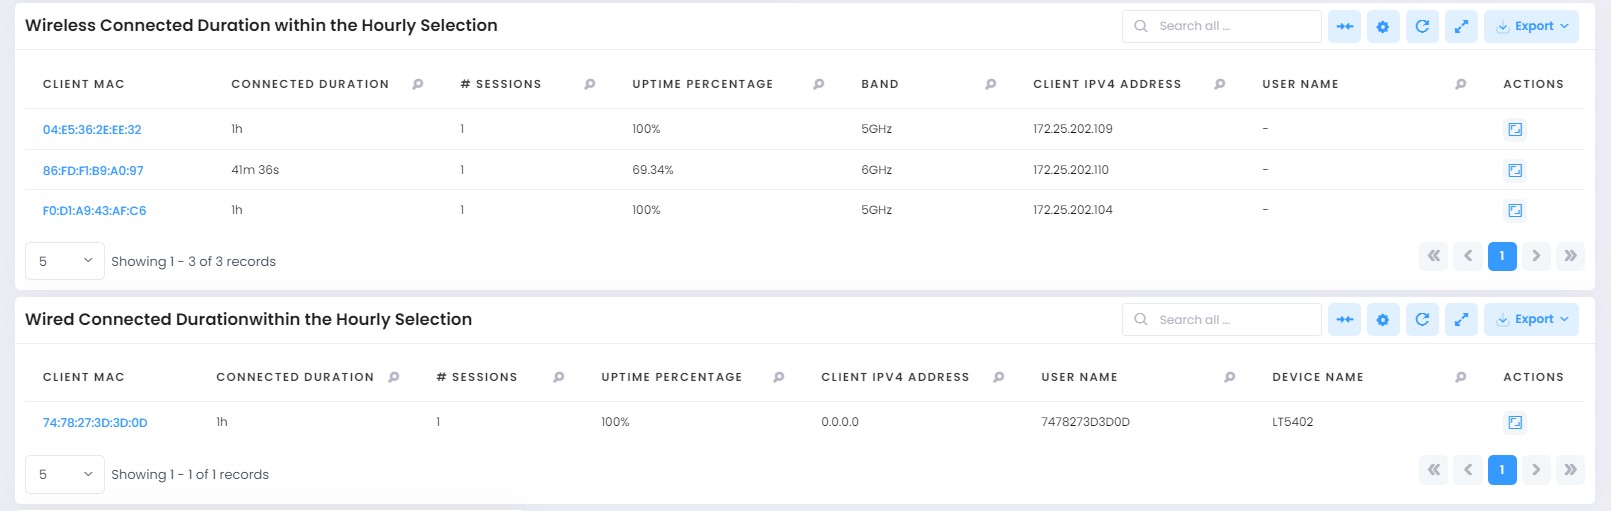
For each historical client session, the following attributes are displayed in the duration table:
Client MAC - The MAC Address of the client.
Connected Duration - The total amount of time for all the client sessions.
# Sessions - Total number of client sessions.
Uptime Percentage - The percentage Uptime of the Client sessions.
Band - The radio band through which the client attached to the AP (2.4GHz or 5GHz).
Client IPV4 Address - The IPV4 address of the client, if applicable.
User Name - The user name of the client.
Device Name - The name of the client device.
Device Type - If determined, the Device Type of the client. (e.g: Mobile, Computer, ...).